CRM vs. CDP: the limitations of using a CRM as your main customer base

The CRM solution has long been used as the main customer base by companies. The CRM software, whether “Sales” CRM like Salesforce, or a “Marketing” CRM like Splio or Adobe Campaign, was used both as a customer base and as a customer relationship management tool.

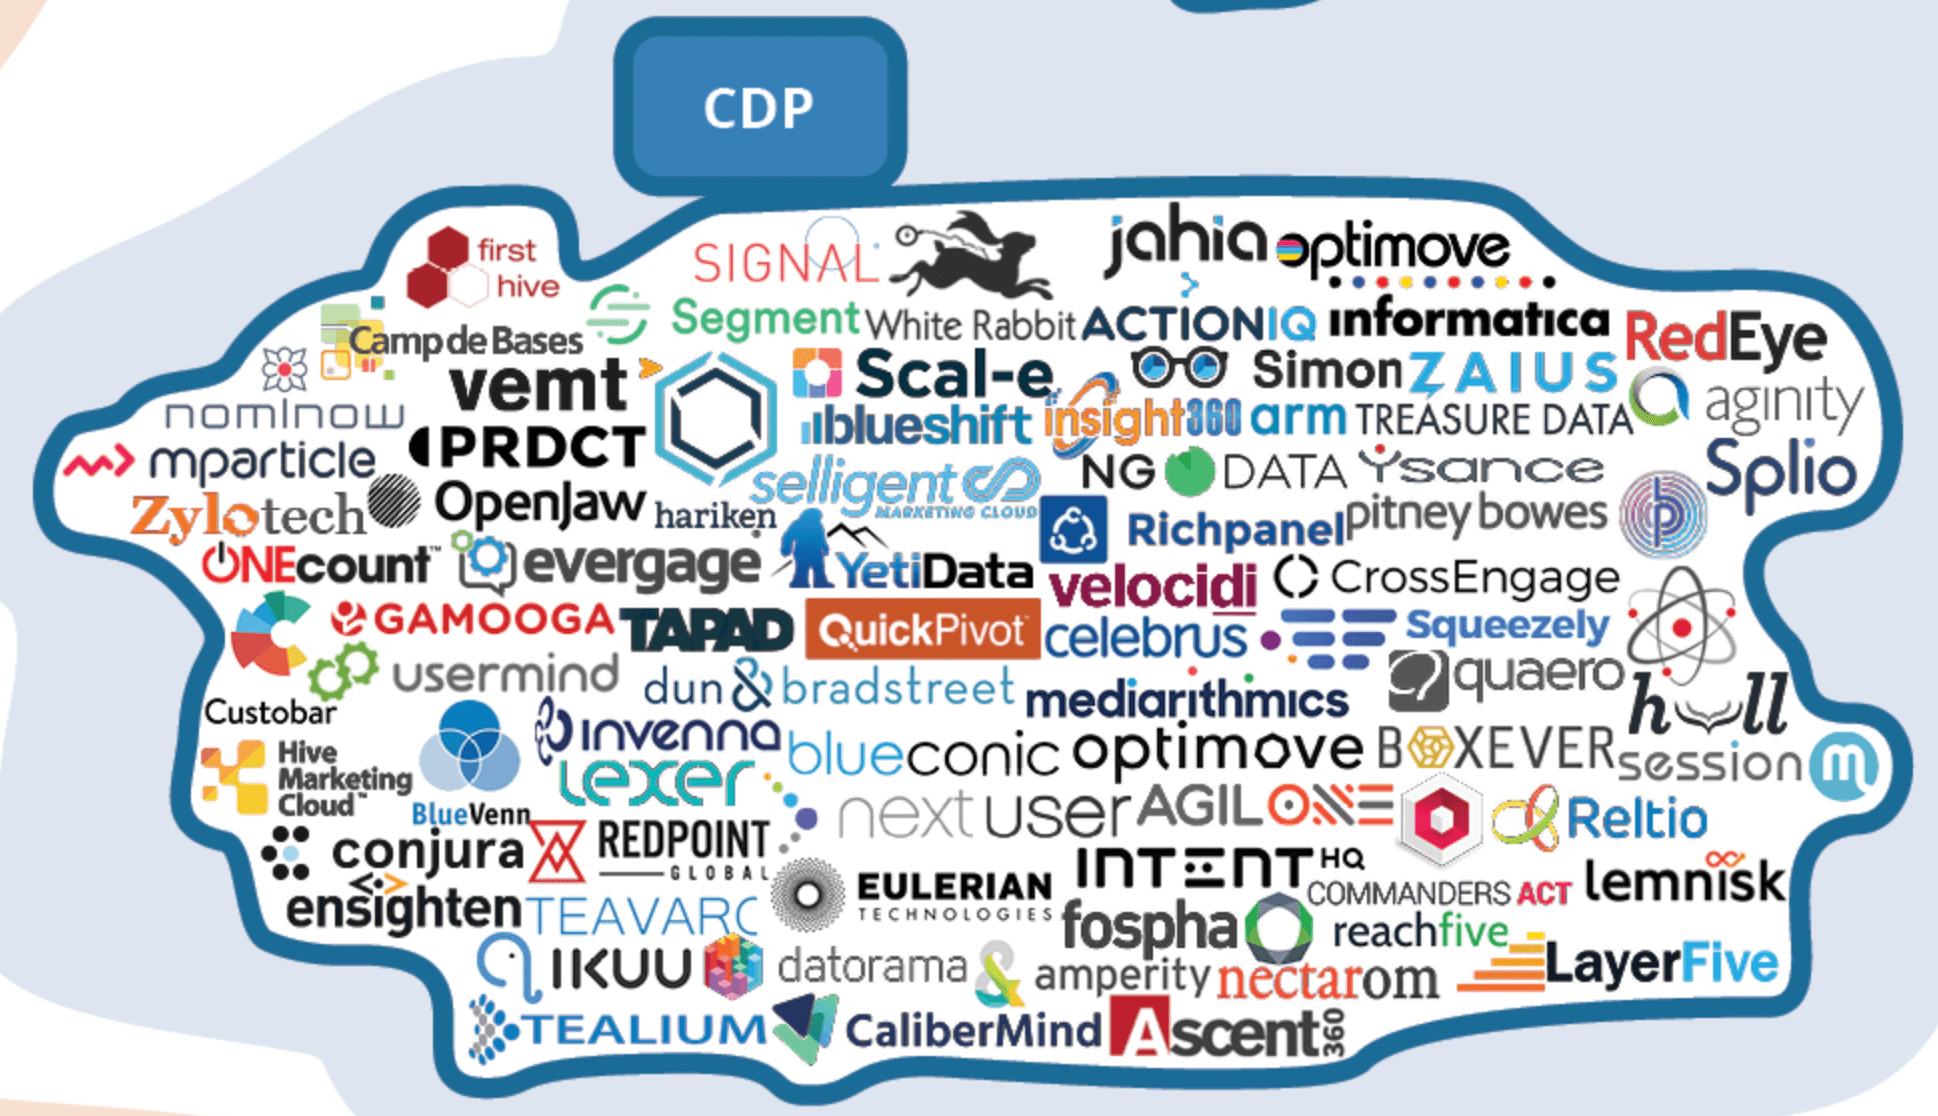
Then a new family of software appeared: the Customer Data Platforms (or CDP), designed to play the role of customer database instead of the CRM. CRM softwares has structural limitations when it comes to database management. CRMs do not handle behavioral data, real-time data or multi-source reconciliation (which is essential for unified data). These limitations explain the rise of CDPs.

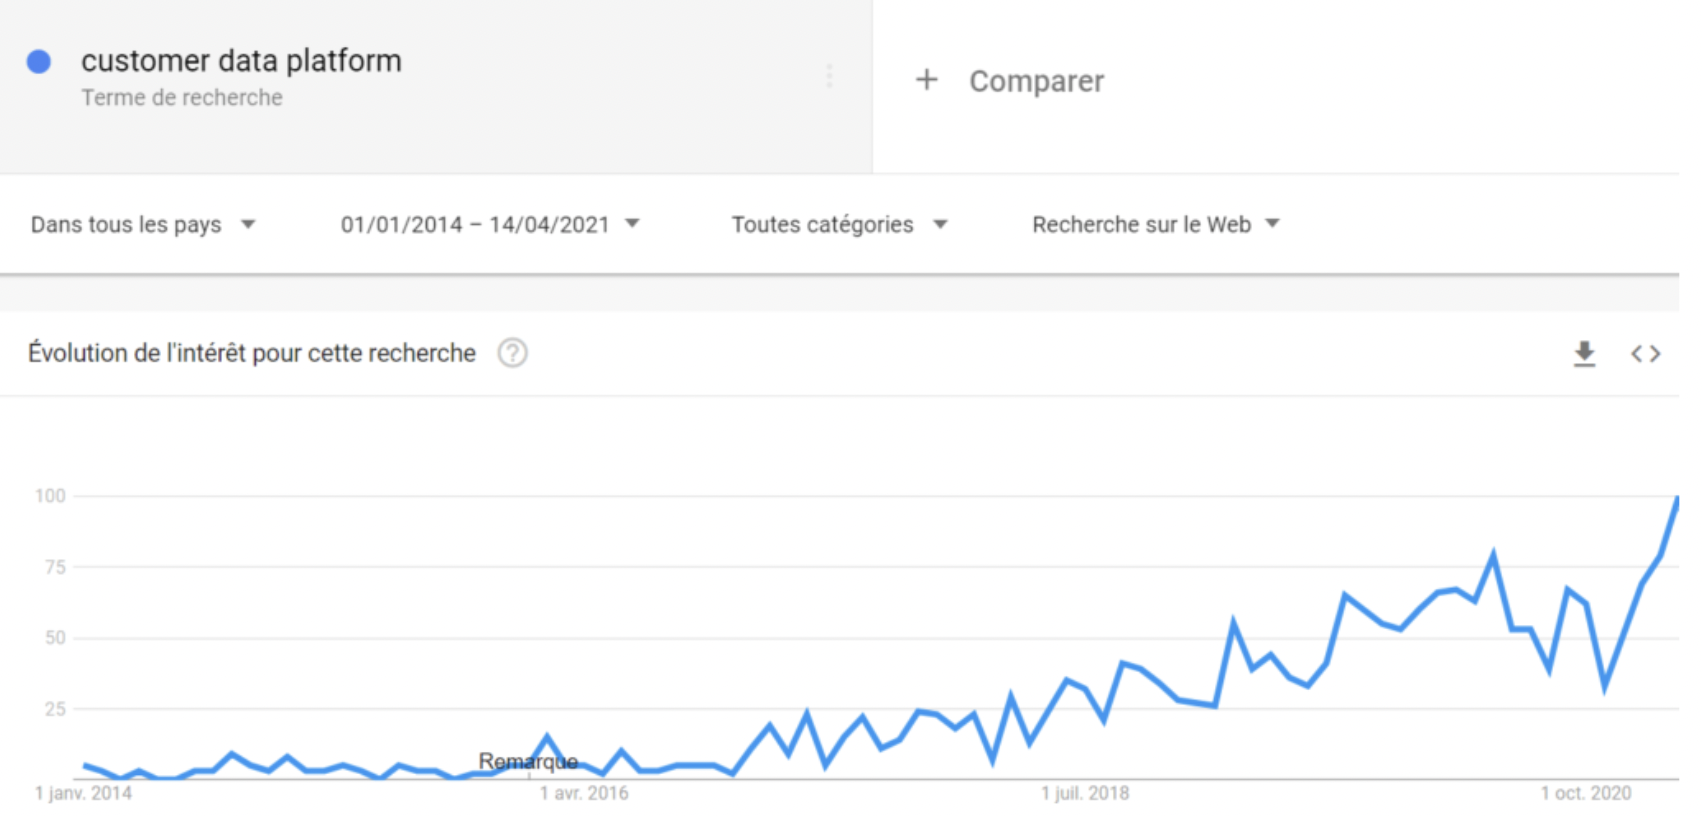
With the multiplication of tools, data sources and the growing importance of behavioral data, more and more companies are choosing to manage their customer base independently of their main CRM software. This new paradigm of decoupling the customer base and activation tools is made possible by the latest generation of CDP.

When looking to build or improve your CRM ecosystem, you need to ask yourself this key question: which system or tool should play the role of the primary customer base? Some companies still believe that CRM is able to play this role. Others, on the other hand, choose to equip themselves with a CDP. Most companies are a bit confused and don’t know what to think. If you are one of them, don’t worry, we have written this article for you.

In this publication, we will start by helping you to better understand the differences between CRM and CDP. We will then take the time to outline the requirements for a customer base to act as a customer repository. This will lead us to discuss the various reasons why we believe that CRM software is no longer suitable for this role.

Understanding the differences between CRM and CDP

First of all, it should be remembered that CDP and CRM are not competing solutions, but complementary ones. A company that is equipped with a CDP usually also has a CRM.

To begin, here is a table summarising the main differences between CRM and CDP:

CRMCDP
RôleGérer la relation clients : les interactions commerciales (gestion des leads), marketing (campagnes et scénarios) et servicielles (support client)) Gérer la base de données clients : réconciliation des données autour d’un ID client, hub data pour les autres systèmes
UtillisateursProfils métiersProfils martech ou data
Ingestion de donnéesBatch ou manuelTemps réel ou presque
Réconciliation / déduplicationBasée généralement sur l'emailRéconciliation déterministe ou probabiliste basée sur plusieurs clés
Transformation de donnéesBasique ou inexistanteAvancée : normalisation, enrichissement, segmentation, scoring, création d'audiences...

CRM definition – Customer Relationship Management

A CRM software is used to centralise the management of customer interactions. There are four families of CRM:

  • Sales CRMs, used by the sales teams, designed to manage the follow-up of commercial opportunities, drive commercial activity. This is the oldest CRM family.
  • Marketing CRMs – or marketing automation tools – used by the marketing team, designed to manage customer segmentation, marketing campaigns and scenarios.
  • Customer service oriented CRMs, intended for contact centres and used to manage interactions on customer service channels: tickets, telephone, livechat…
  • All-in-one CRM solutions that manage sales, marketing and service interactions equally well.

The CRM is therefore a tool before being a database. Except that, as we recalled in the introduction, CRM has in fact been playing the role of a database for a long time. It stores :

  • Cold data, essentially profile data and contact information: last name, first name, gender, date of birth, telephone, postal address.
  • Conversational history: email exchanges, social media, appointment notes, etc.

Vendors have all developed connectors for CRM to accommodate other types of data, for example transactional data and, with much less success, behavioural/web browsing data. This has contributed to the evolution of CRM from an activation and interaction management tool to a primary customer repository.

Reminder – Customer Data Platform definition

A Customer Data Platform is a technology that is used to unify customer data, prepare it according to business use cases and, finally, redistribute it to other business systems (activation tools and reporting tools). It is basically a data management tool.

A CDP is used to carry out 4 main activities:

  • Connect. It connects to all of the company’s customer data sources, with data flows that can be built via native connectors, APIs, webhooks, flat file uploads, etc.
  • Structure. Data is organised in a customised data model according to the needs of the business. It is de-duplicated based on one or more reconciliation keys. Deduplication allows data to be consolidated, reconciled and unified around persistent customer profiles.
  • Prepare. The data, once unified, is used to build audiences, segments, scores and other computed fields.
  • Synchronise. Segments, audiences, scores are then redistributed to activation tools (CRM, Customer Service, Marketing Automation, advertising tools…).

The CDP Institute has identified some criteria for a solution to qualify as a Customer Data Platform:

  • Integrate data from any source.
  • Capture all the details of the ingested data.
  • Store ingested data permanently..
  • Create unified customer profiles.
  • Share data with systems that need it.

Focus on the main differences

Let’s summarise the main differences between CRM and CDP here:

  • The purpose. CRM is used to manage the customer relationship, CDP to manage customer data. CRM and CDP are both used, although in different ways, to improve customer performance.
  • The users. CRMs are used by operational teams involved in managing customer dialogue: sales, marketing, customer service mainly. CDPs are intended to be used by rather tech-savvy marketing profiles and data teams. CRM and CDP are designed to be used autonomously by business teams (without the IT team).
  • The data. A CRM manages cold data and relationship records (conversational, contractual, transactional) very well but poorly with hot data. However, a CDP manages all types of data, including behavioral data (web tracking…). CRM and CDP are essentially focused on first-party data, following the sense of history (end of third-party cookies).
  • The mode of data ingestion. CDPs handle real or near-real time, either as input (connection to sources) or output (distribution to destination tools). CRM data is either ingested in batch or manually recorded by users. This is because CRM use cases do not require real-time ingestion.

What does it take to properly manage your core customer base?

The formulation of the differences between CRM and CDP already gives some clues to the question we set out to address in this article: which tool or system should play the role of the main database. Let’s continue our investigation. We will now define the main characteristics that a customer database must have in order to play the role of master DB or “Single Customer Repository”.

The main customer base must be exhaustive

The database should centralise all customer data that is of known or potential interest to the business. A company can store different types of data:

  • Profile data.
  • Contact information.
  • The history of interactions, whether conversational or transactional.
  • The preference data.
  • Behavioural data: web browsing, product usage (within the software or the app)
  • Engagement data, e.g. email behaviour (opens, clicks, etc.).
  • Etc.
  • .

There are many ways to categorise different types of customer data. It does not matter here. The main thing to remember is that a customer database, in order to be exhaustive and play its role as a master database, must be able to handle all types of data: hot data as well as hot data, third party data as well as personal data, online data as well as offline data, web logs as well as phone numbers.

The main customer base must be unified

The main customer database is intended to aggregate all the customer data collected via the company’s various data sources. This aggregation necessarily produces duplicates, which can have 2 origins:

  • A customer may be identified differently in two different tools. For example, a customer may be identified by email in the Marketing Automation tool, by a customer number through its personal account and by a phone in the customer service software. As a result, if you don’t use a matching key, you won’t be able to tell that it’s the same customer behind the three identifiers. You will have three duplicates, three unreconciled identities.
  • The same tool can store the same customer in two different places. Example: if you use a CRM that uses email as a unique identifier and a customer uses two emails, you will have two contact records, two identities.

In both cases, the problem is basically the same: there is no identity resolution.

It is essential to be able to unify the data that reaches the main customer base. How can this be done? By setting up more or less complex deduplication rules, enabling data to be matched and records to be merged.

The main customer base must be clean

A clean database meets 4 conditions. The data it stores must be :

  • Subject to a consistent and appropriate data model. The data model defines how the data comes to be organised in the tables that make up the database.
  • Normalized. Normalisation refers to the way in which data is recorded and displayed. For the object “gender” for example, one can use the formats “F” and “M”, or “Female” and “Male”…For each object, one and only one format must be defined. This is what is known as the “normalisation” of data.
  • Cleaning. Cleaning refers to the process of checking the accuracy of data and removing/updating inaccurate data.
  • Regularly updated. Data cleansing, which is a one-off and periodic operation, must be complemented by the implementation of automated data flows allowing for regular data updates, even in real time in the case of behavioural data.

A customer database, in order to play the role of a main database, must therefore offer :

  • One or more data models that are sufficiently flexible to meet the needs of the business and the characteristics of its data.
  • Data normalization features.
  • Data quality management and enrichment features.
  • Real time or near real time management to be able to continuously update behavioral/heat data without delay.

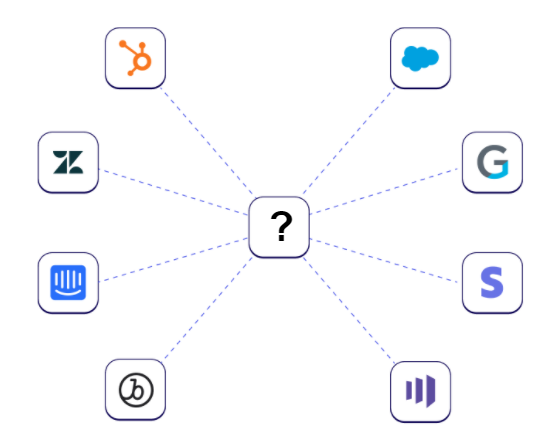
The main customer base should act as a hub with other systems

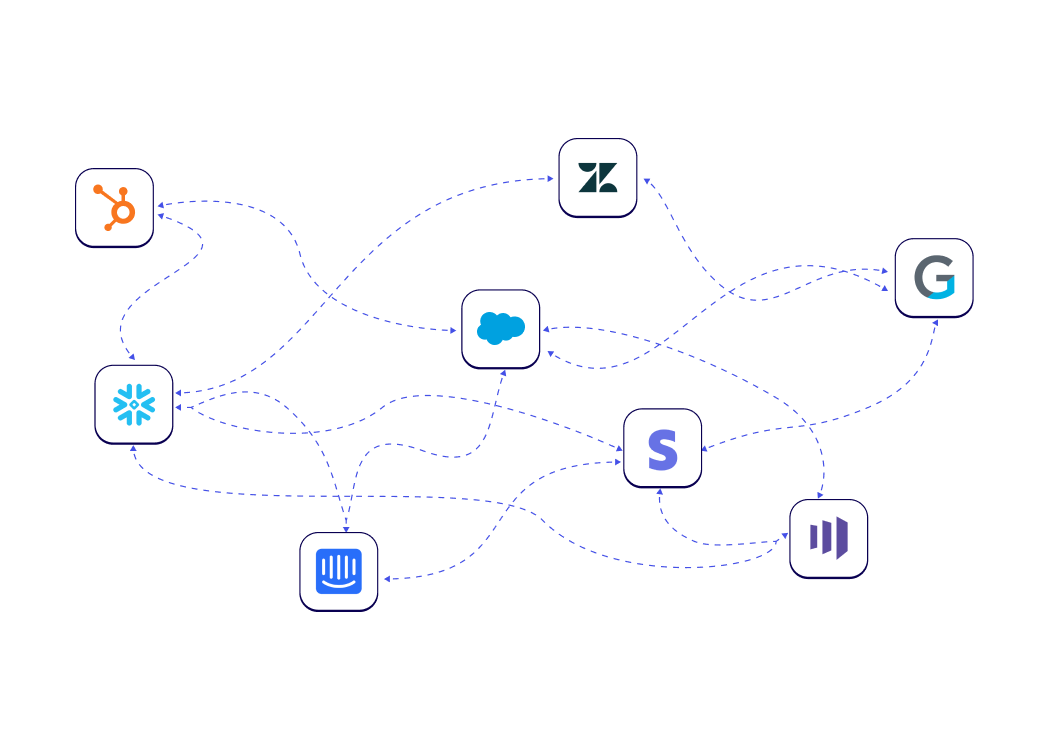
The main customer base must be able to easily feed the company’s other systems, whether they are operational/activation tools (sales CRM, marketing CRM/marketing automation, customer service CRM, advertising platforms…) or analysis tools (BI, reporting, data science…).

It should be easy to “wire” to the destination tools, whether via native connectors, a robust API, webhooks or manual exports.

The structural limitations of most CRM / marketing solutions to play the role of customer base

Most CRM/marketing software are not designed to play the role of the main customer database, for the good reason that it is customer relationship management software, not customer data management tools.

Rigid data model

The data model proposed by CRM solutions is more or less rigid, often more than less. As a reminder :

  • Lightweight CRMs (campaign managers or small Sales CRMs, for example) are single-table. All the data is organised in a single table.
  • Intermediate tools are multi-table but “frozen”. The data model is organized on several tables (customers, products, orders…), but it is difficult to add new tables or to modify the relationship between tables.
  • Advanced tools like Salesforce are both multi-talented and flexible.

The consequence is that updating the data model of a CRM is difficult, unless you have a very advanced (and usually very expensive) CRM like Salesforce. First limitation.

No multi-source reconciliation

In most CRMs, the email is the key. This means that if the same individual registers with two different emails, this will create two lines within the CRM, even if the individual has registered with the same phone, the same first name x surname, the same postcode…

The consequence is that this generates duplicates in the Contacts table, as we saw earlier, but also some difficulties in associating the contact with all its touchpoints. If, for example, an customer writes to the customer service department with a different email than the one they registered with, and if I cannot reconcile the contacts and the customer service tickets using several keys, then it will not be possible to associate the individual with the customer ticket.

To do this, the CRM must be able to manage multi-source deduplication rules. It is with this type of rule that we could tell the tool: “If two contacts have a different email address but the same postal address + the same first name, then the two contacts must be deduplicated and merged”.

No or little normalization & data cleansing

In a CRM tool, the possibilities for data cleansing are very limited:

  • Normalisation. It is not possible to use “Find & replace” rules that allow, for example, all “FR” to be replaced by “France”, or all “Miss” to be replaced by “F”.
  • Cleaning up important fields. CRMs do not, with rare exceptions, include a service to check the existence of email addresses or to make Postal Address Verifications

Therefore, data normalisation and cleansing must be done on the front end of CRM, using custom scripts that are complex to maintain.

No computed fields & scoring

A CRM tool is like Excel but without the formulas… In most CRM solutions it is not possible to add computed fields. Some CRM tools propose computed fields by default (average basket, cumulative, etc.) which are impossible to modify.

However, the ability to create computed fields is essential, especially when it comes to implementing marketing automation scenarios. For example, in order to exclude customers who have recently expressed dissatisfaction, we need a “status of the last customer ticket” or “number of customer tickets over the last X days” field. Creating this type of computed field (scoring or otherwise) is very difficult, and often impossible in a CRM.

No direct access to the database for reporting

A main customer database is used to activate customers, to “act”, but also to analyse the data and to do reporting. Reporting on a CRM database is not easy, because the reports available in the tool are very quickly limited.

Let’s take the example of automated scenarios. In order to measure their impact, we need to use cohort analysis. For example, if we want to deploy a new upsell scenario that consists of sending a sequence of messages 1 month after the first purchase, we will need to look at each monthly cohort of new buyers to see if the number of purchases after 2 months has increased.

How do you do this in CRM software? There is only one solution: export the data to a database/datawarehouse, and then connect your reporting tool to the database in question. It is not possible to connect the reporting tool directly to the CRM software, you have to go through the database…

History’s direction is the decoupling of the customer base and the activation of customer data

From the “software CRM” to the “ecosystem CRM”

CRM today refers to the management of all interactions and activations with identified customers. In most companies, CRM is no longer operated by a single software, as in the past, but by a set of tools, a combination of solutions:

  • A campaign manager.
  • A marketing automation tool (or CRM Marketing)
  • .

  • A sales activity and sales pipeline management tool (or CRM Sales)
  • .

  • A helpdesk/ticketing tool (or Customer Service CRM).
  • Advertising platforms to retarget known customers with Ads.

CRM has become an environment, an ecosystem of software. This is one of the reasons why it is no longer really possible to use CRM as a customer repository: a company uses customer tools, but needs a master customer base.

The benefits of managing a customer base separately

If you have read all of the above, you are probably beginning to realise the benefits of managing a customer base separately.

Having a separate customer base allows you to :

  • Connect all of the company’s customer data sources, in complete freedom, without limitations and in a simple manner (through connectors, APIs…). The connection capabilities are indeed slowed down when the customer base is built in a tool that belongs to a constituted ecosystem (Salesforce for example): the editor will often try to get you to use the other tools of its suite.
  • Create a single comprehensive customer view, combining hot and cold data. This benefit follows from the previous one.
  • Prepare data in one place. You centrally manage customer segments, audiences, scores, deduplication rules…You no longer need to do this work in every tool in your CRM ecosystem.
  • Do not lock data into a rigid data model. You create a flexible, bespoke data model, tailored to your current and future use cases.
  • Easily synchronise prepared data in the different systems that need it, in real time when necessary.
  • Be able to use the customer base to feed activation tools but also reporting tools, and this directly, without having to go through an intermediate system.
  • Staying in control of your customer data. The issues around data control are becoming crucial for many companies. Building an independent database allows you to keep full control over your data.

Small presentation of the approach proposed by Octolis

We have been Data / CRM consultants for many years. We have often been confronted with the limits of CRM in the course of our missions. Some of our clients had a unique customised Customer Repository, which was very flexible, but every change required technical intervention. Other clients had first generation CDP solutions, you have a nice interface to manipulate the data, but the downside is that you don’t have control over the data, and less flexibility on the data model.
It seemed obvious to us that we needed to reconcile the two approaches. A custom database, controlled/hosted by mature customers, completed with a software interface on top.

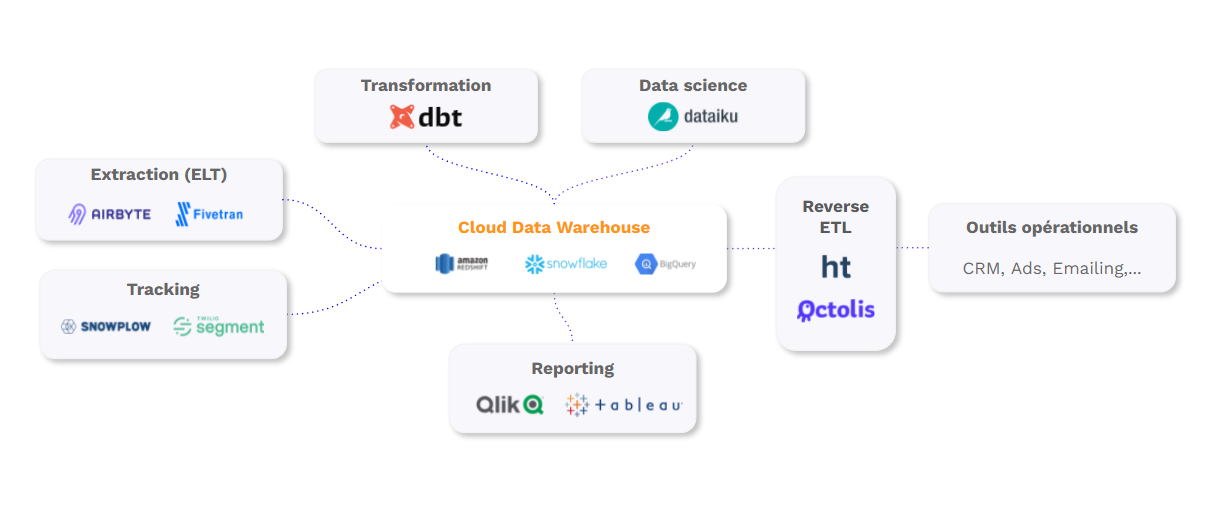
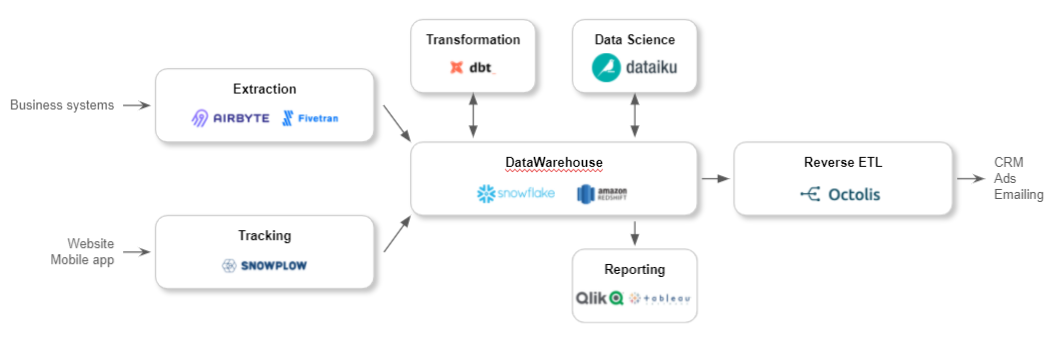
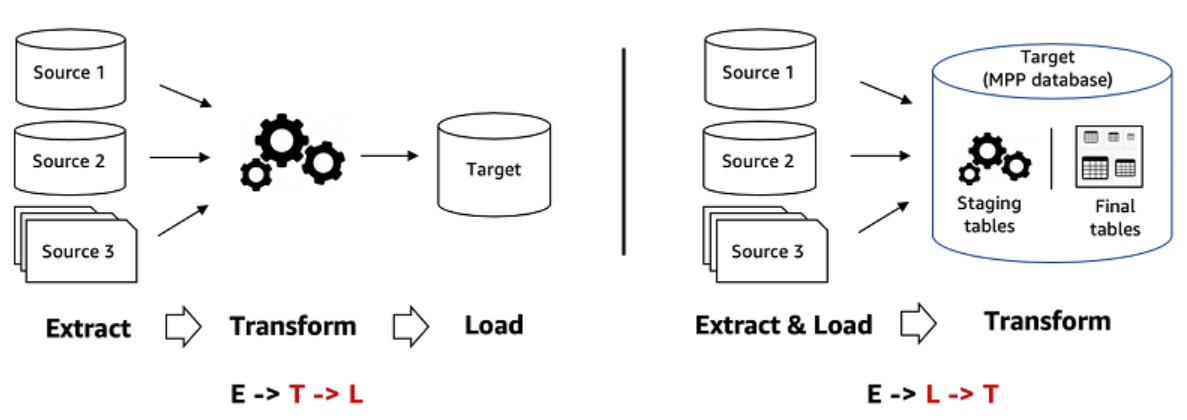
This is the way the story goes. The democratisation of datawarehouses is encouraging this hybrid approach. CDPs are leading the way, but we are starting to see other types of SaaS software that use the customer’s data warehouse as a foundation.

Some of our clients already have a main client base: in this case, we “plug” Octolis into this base. If you do not yet have a main database, Octolis will create one for you.

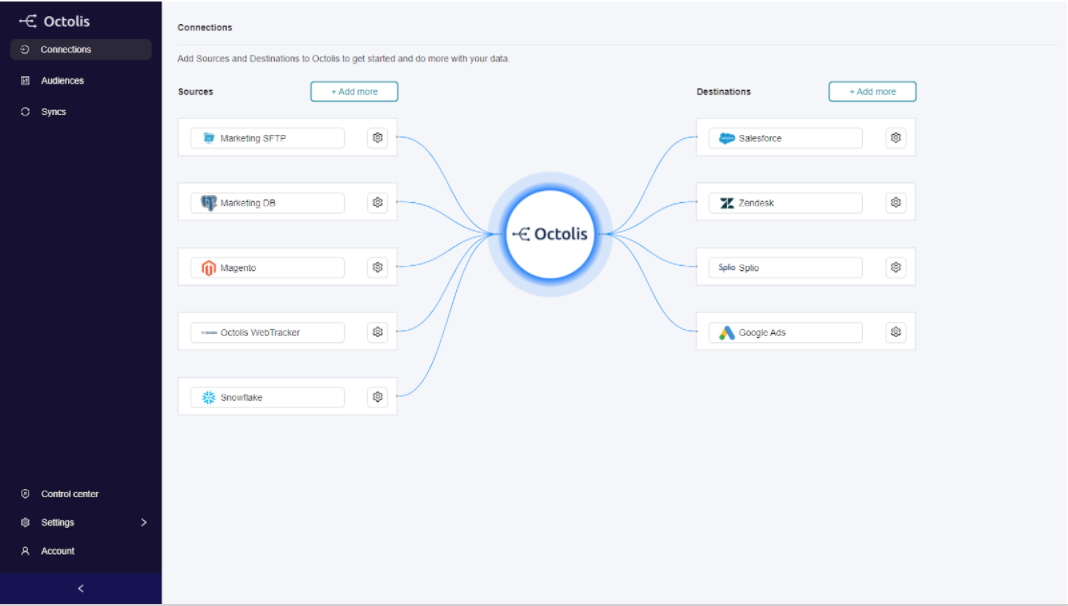
We wanted to create a self-service software interface, accessible to business profiles, usable by both marketing profiles (in “no code”) and data teams in SQL. As a new generation CDP, Octolis allows you to manage the 4 functions that we presented above: Connection, Preparation, Structuring, Synchronisation.

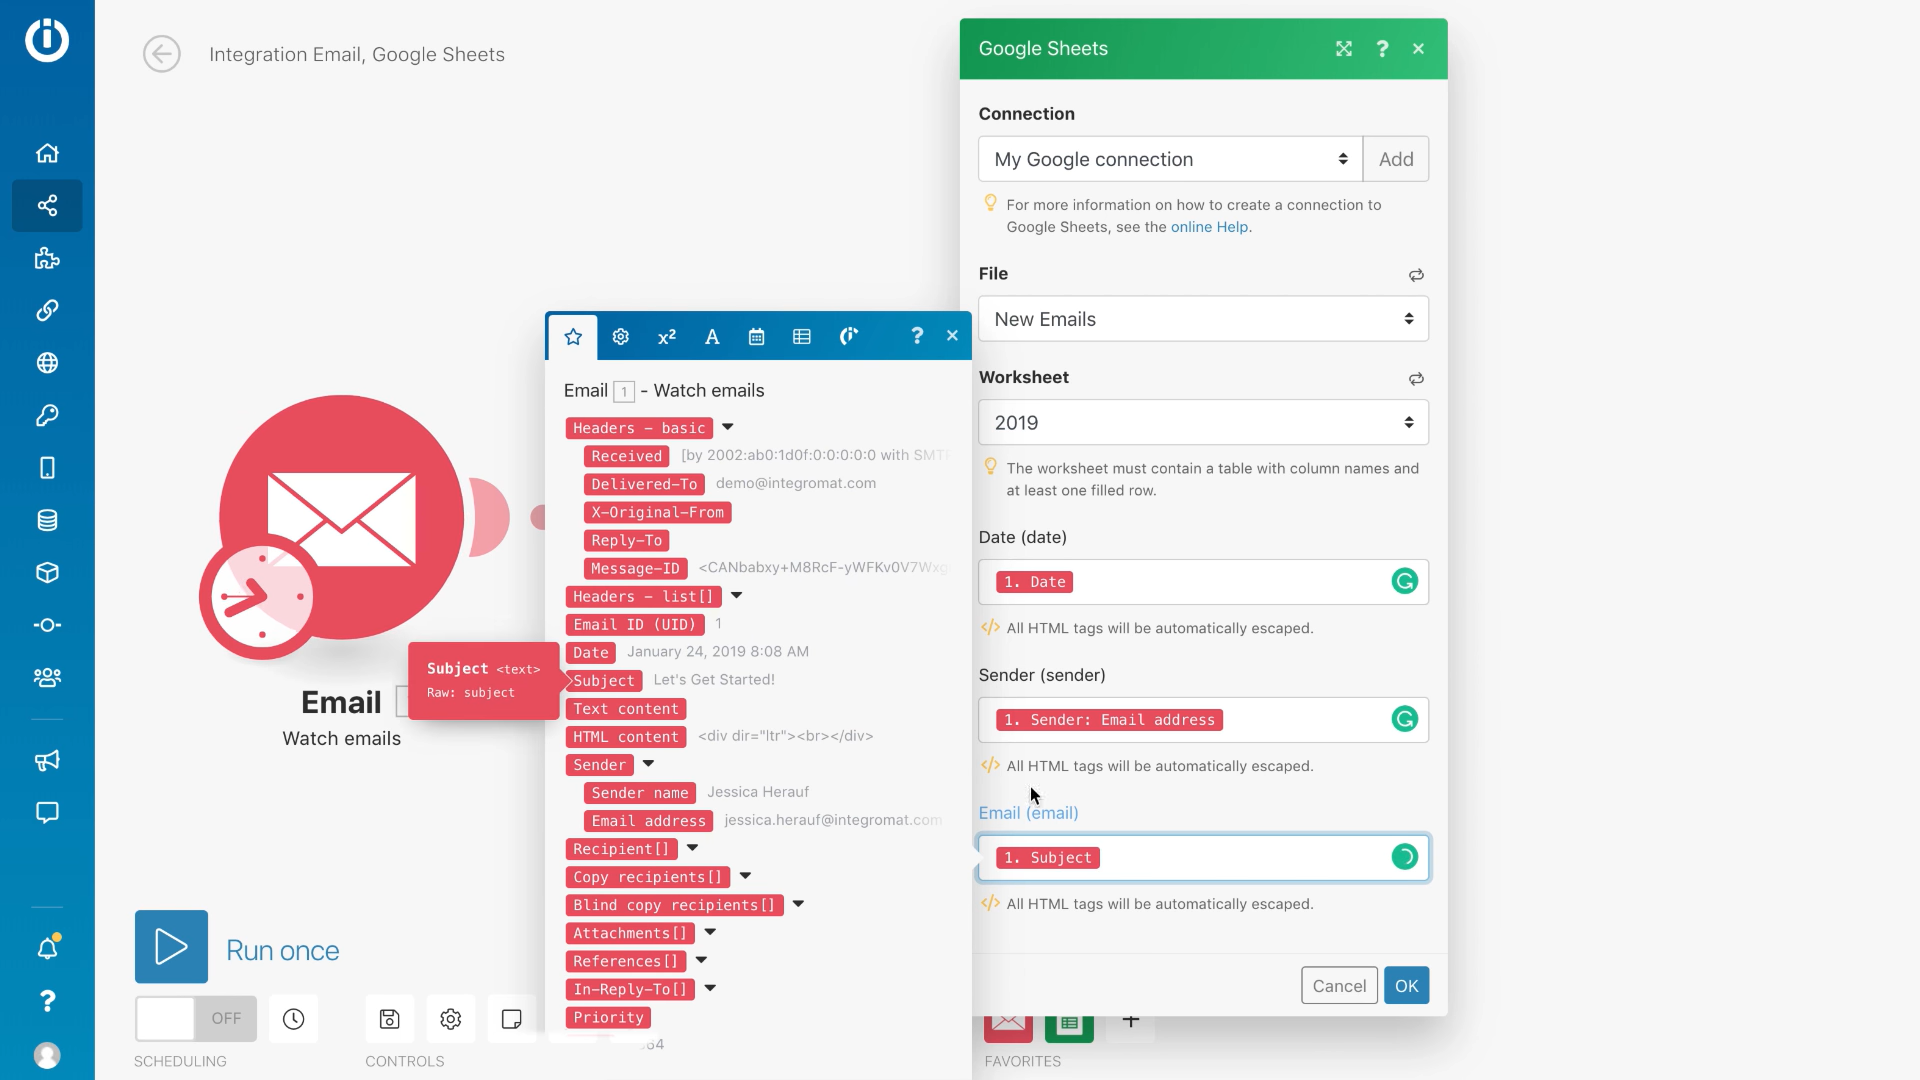
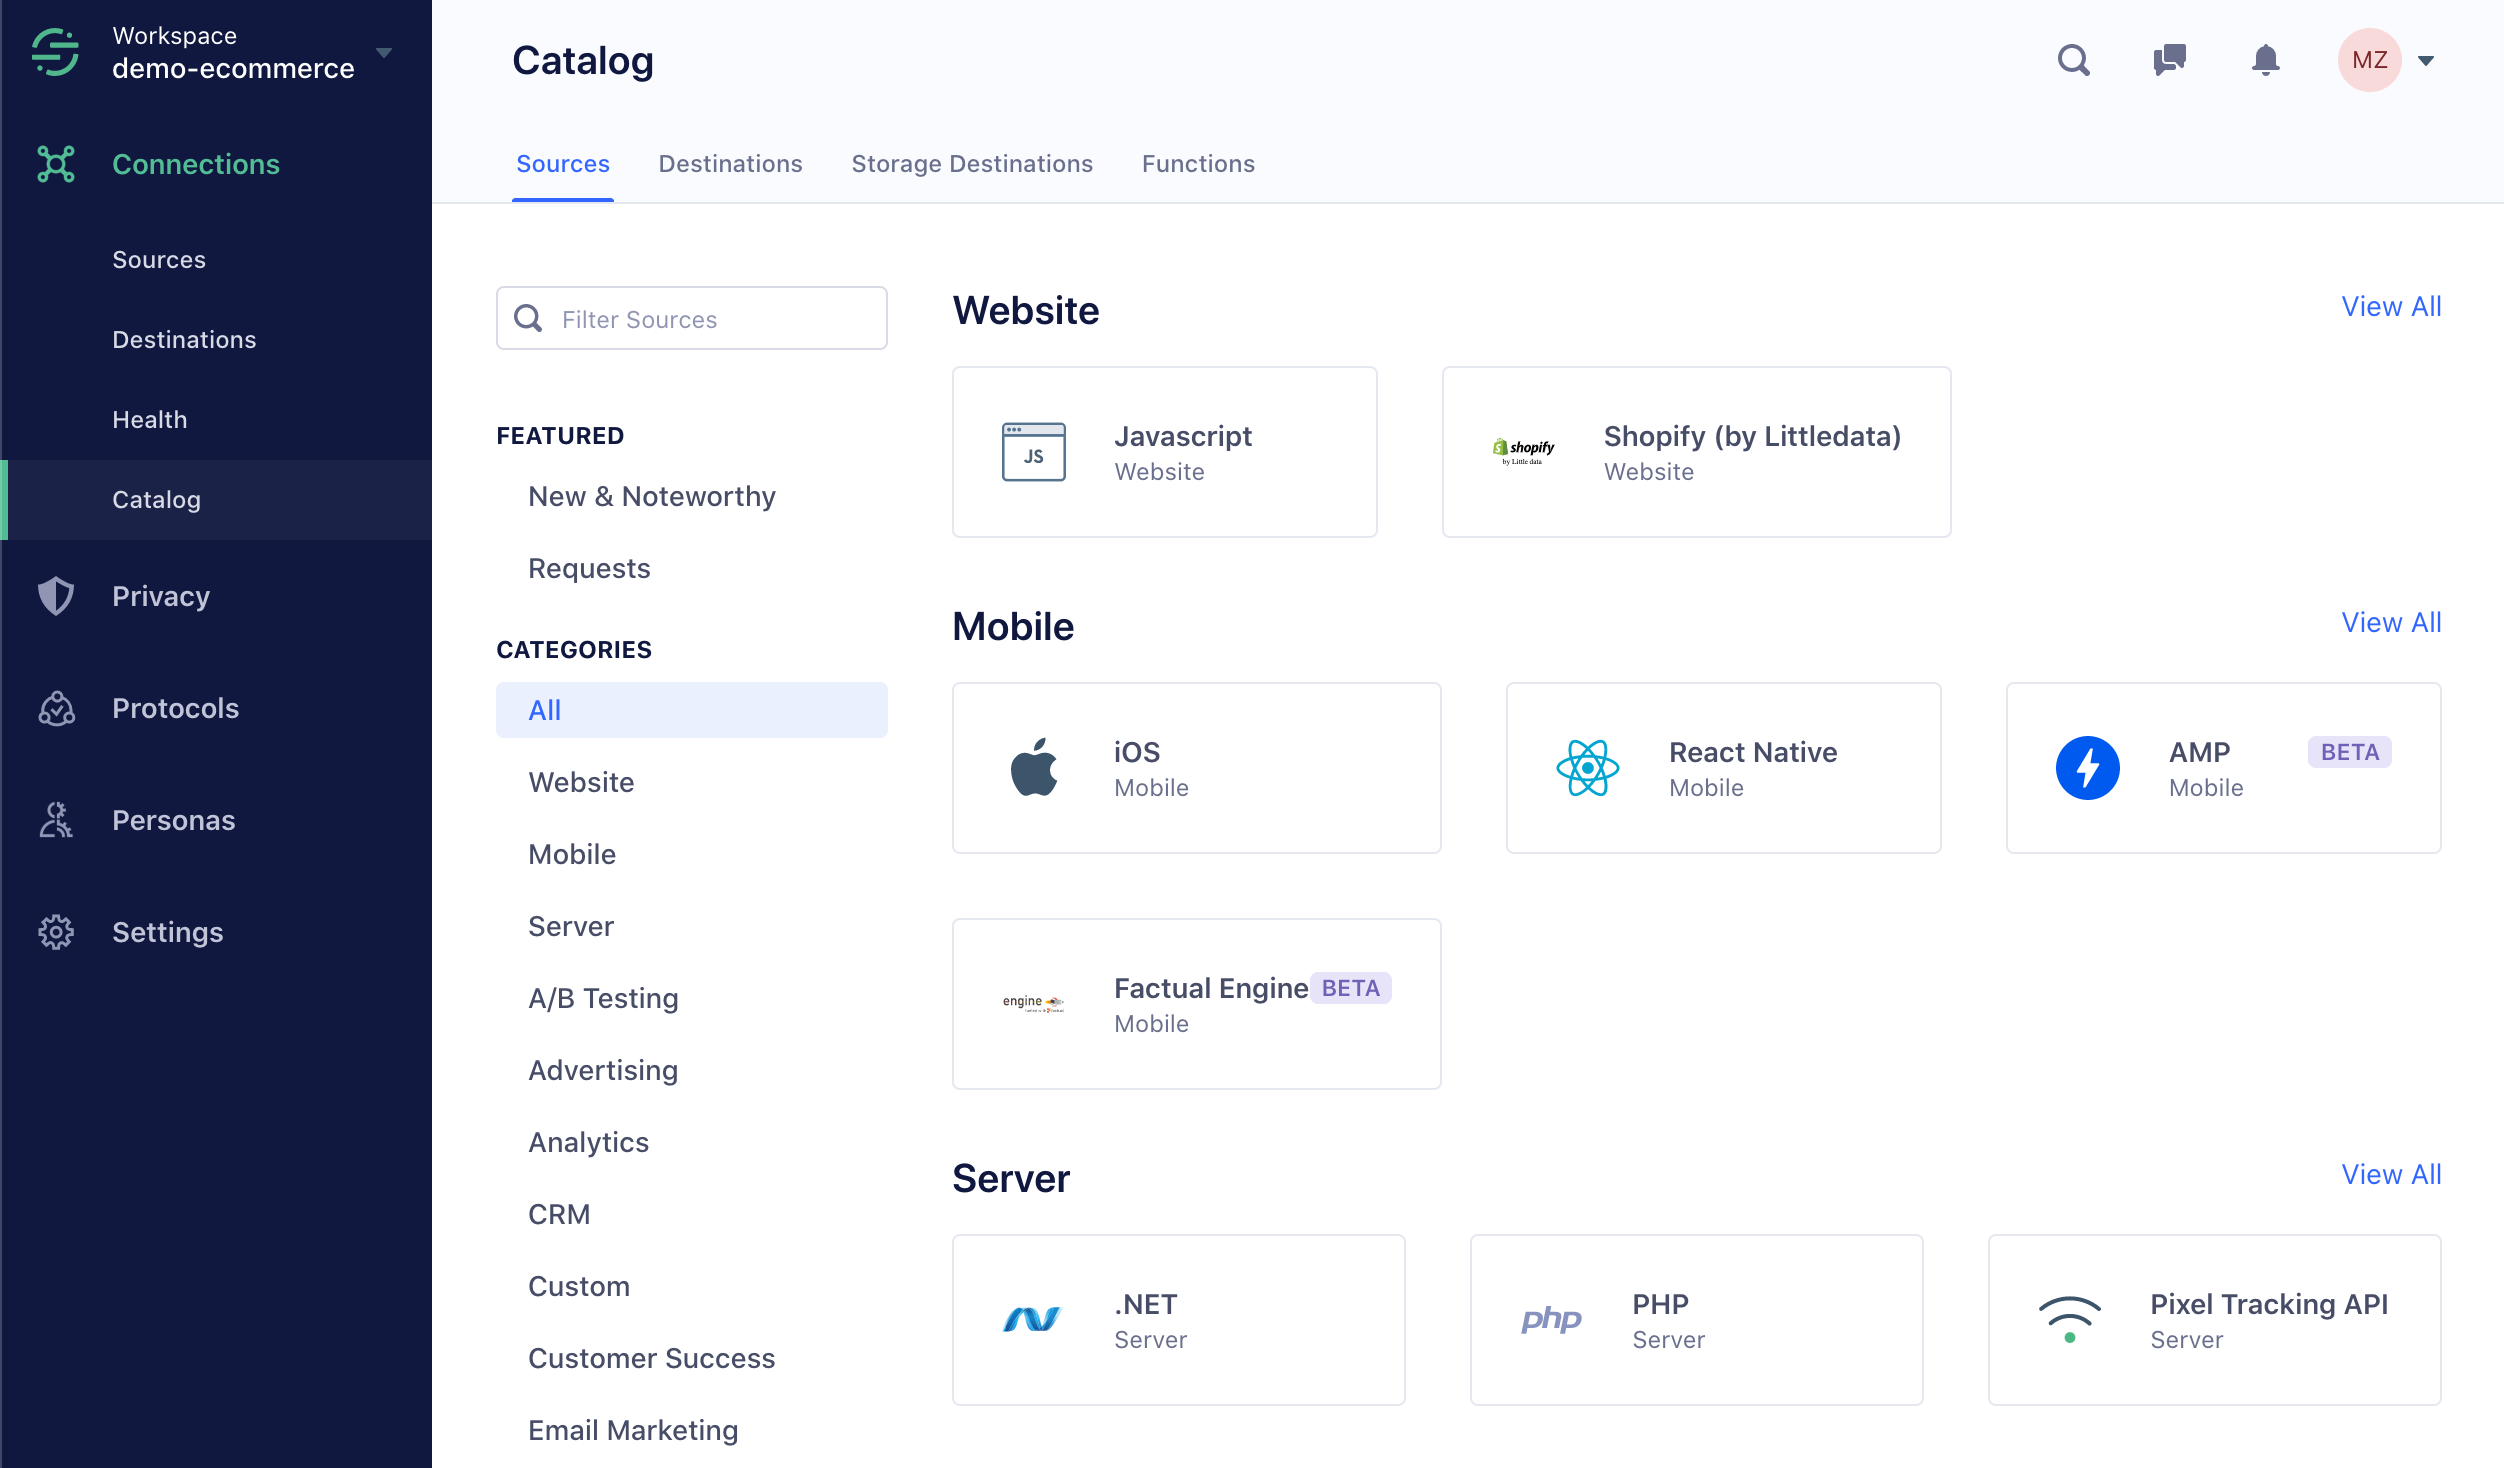
Here is a very quick overview of the solution. You are first asked to connect the different data sources. Among these data sources, of course, is the independent customer database.
Octolis-connections
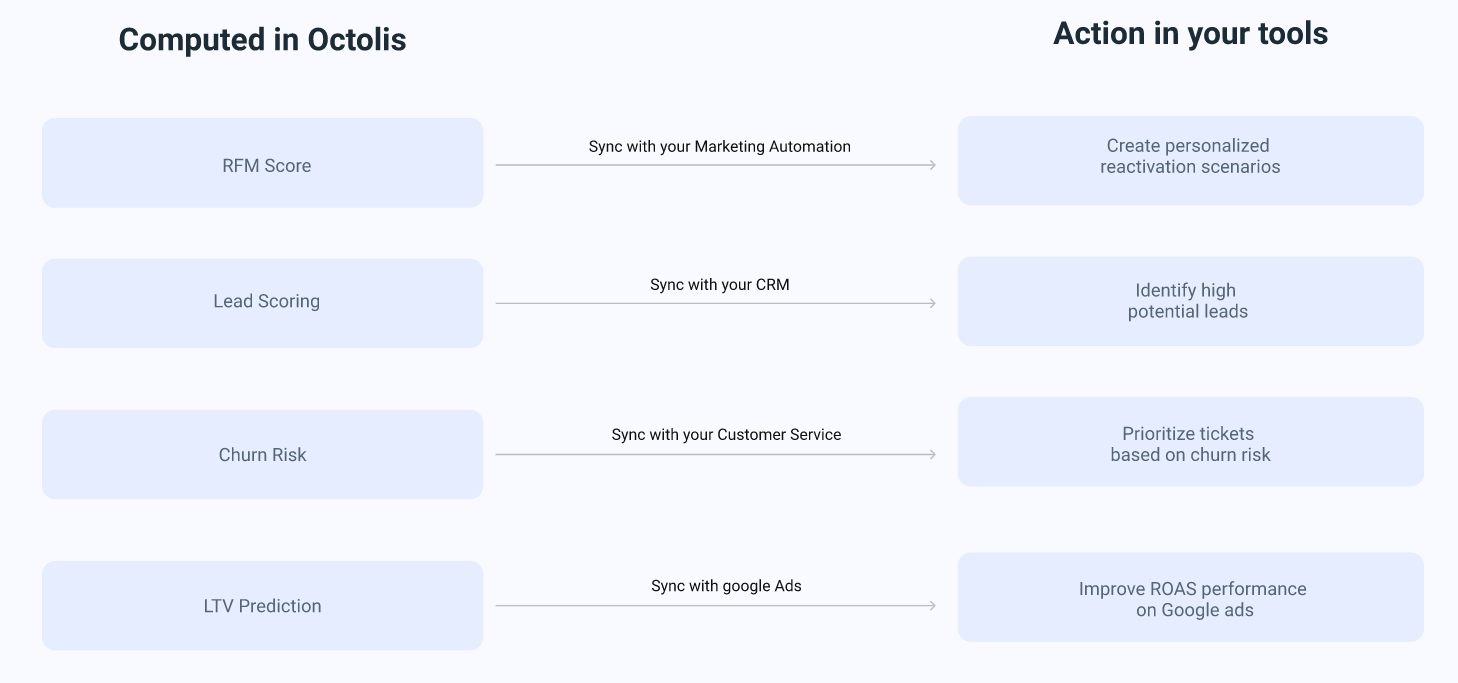
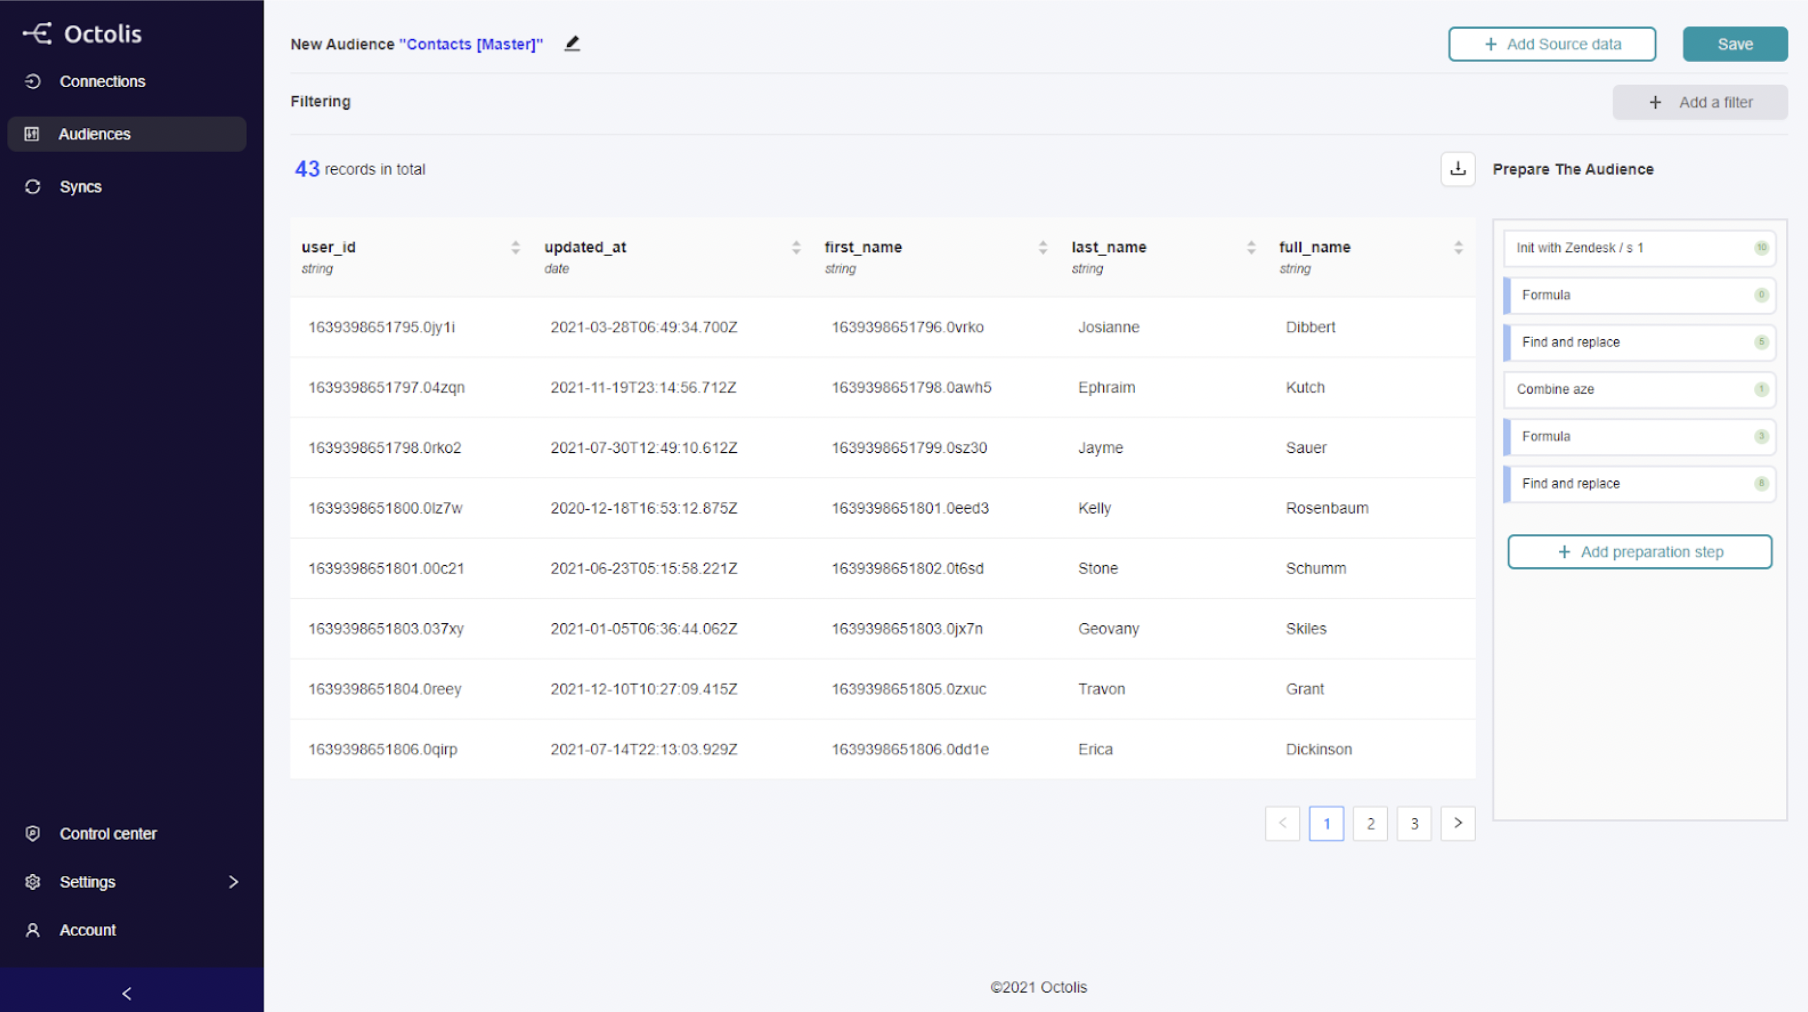
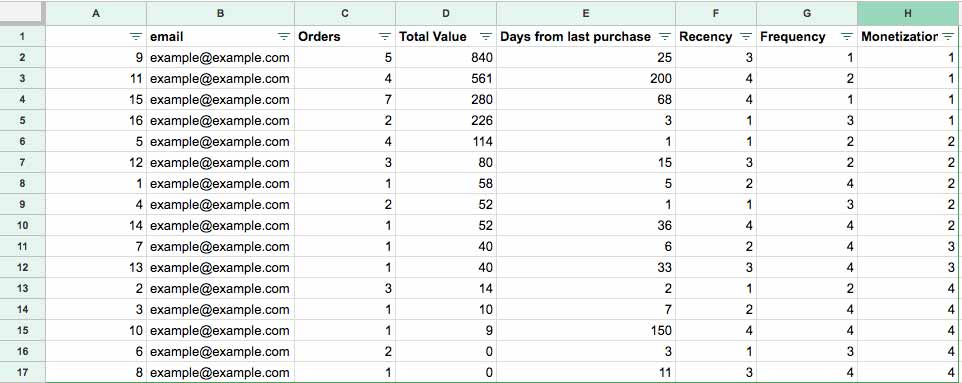
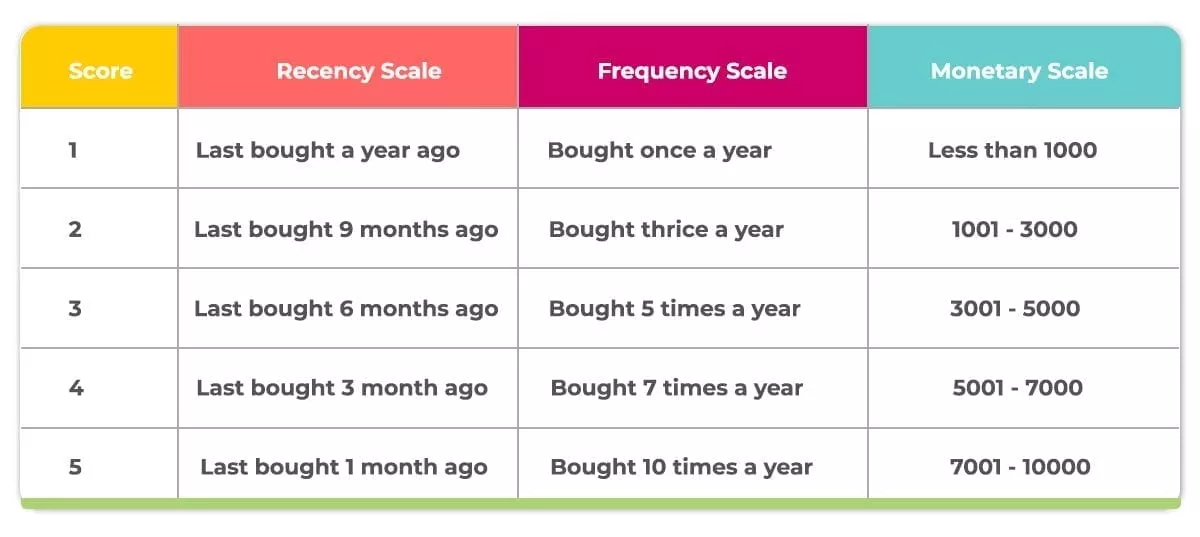
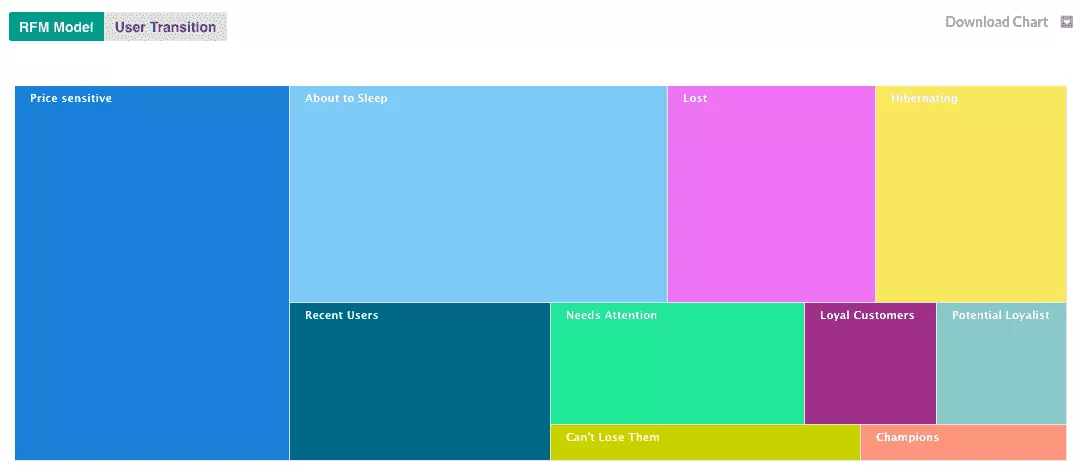
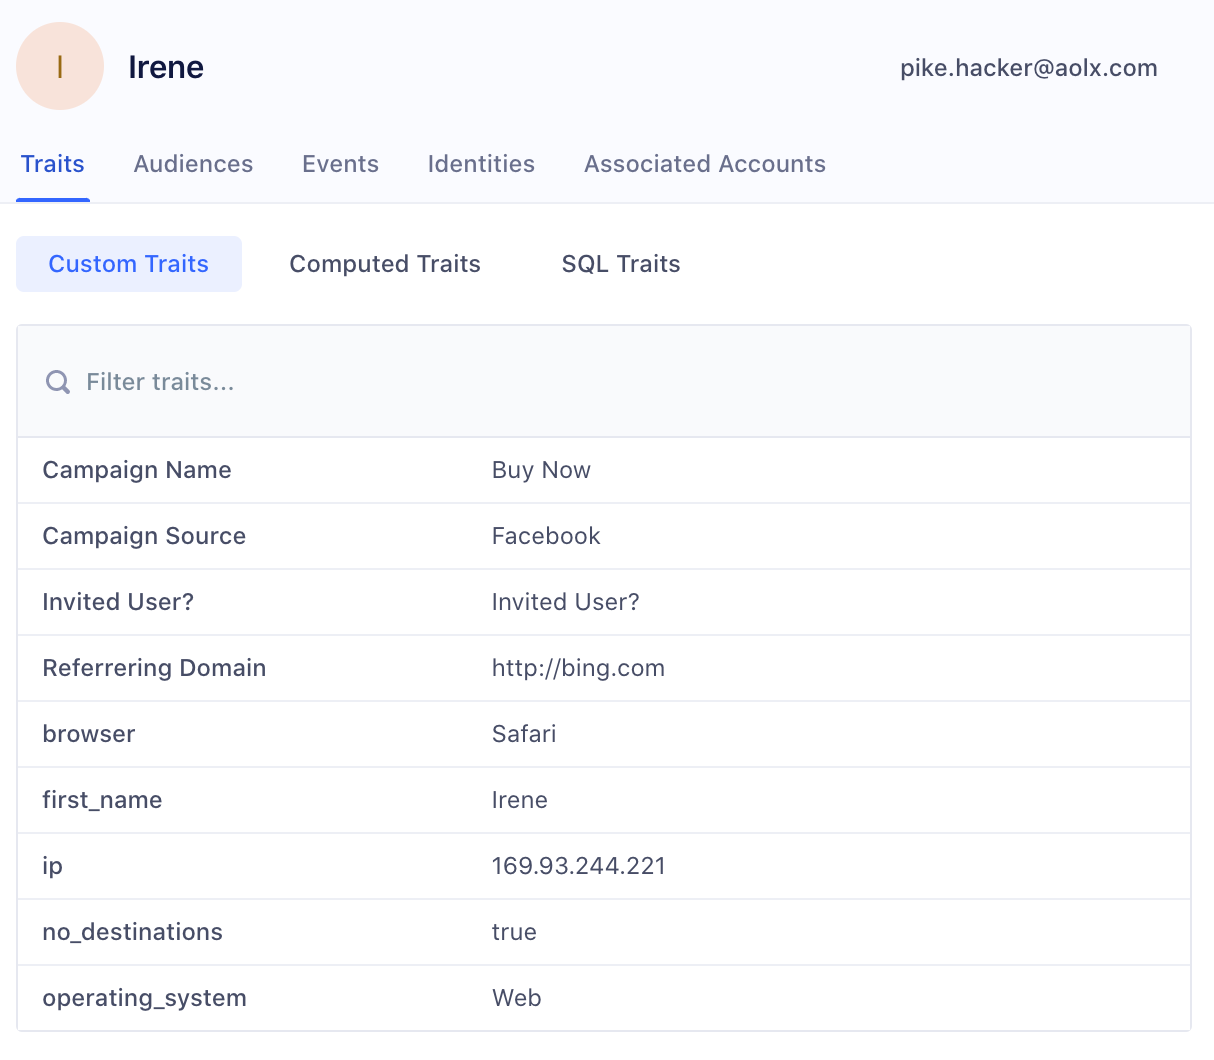
It is on the “Audiences” menu that you prepare and structure the data: deduplication rules, normalisation, construction of audiences and segments, creation of calculated fields (indicators, scorings, etc.).

octolis audiences

You can synchronise the data prepared and transformed in Octolis in your tools and in your main database at any time.

Data Analytics: How Much Does It Cost for a Small/Mid-Sized Company?

Small-mid-sized companies can expect to spend anywhere between $10,000 to $100,000 per year to do data analytics. The amount you will pay depends on the number of employees and your business needs. However, companies should set aside approximately 2-6% of their total budget for data analytics.

Data analytics is no longer a thing for only large enterprises. Today, small and mid-sized businesses also generate a sizeable amount of data. Business owners can gain helpful insight and make more informed decisions with data analytics.

This post provides everything you need to know about data analytics costs for small and mid-sized companies.

Read on to discover how much you’ll spend while optimizing your business.

The data analytics budget should represent 2-6% of your expenses

Most companies offer approximately 2-6% of their total expenses on data analytics, including tools, salaries, and services. It promises a considerable level of growth, and it has revealed that new tools are underway. These tools have been able to help convert raw and unprocessed data into insight.

Data has also grown due to the influence of the Internet of Things (IoT) and connected devices. It has increased in volume while gaining new diversity and richness. For a business to be successful, the available data network has to be optimized.

It offers the opportunity to make better-informed business decisions and refine products or services offered to provide their customers with a better experience. 

Based on a study done by SAS, it has been revealed that 72% of organizations claimed that data analytics has been critical to their innovativeness.

The difference in the performance of more prominent corporations and SMEs has been traced back to analytics as a competitive landscape. Thus, this highlights the need for data analytics.

For example, if a company has a revenue of approximately 2M$, it would require almost 100K$ every year. Ordinarily, this seems like a large amount to spend out of the revenue available, but most companies with this range barely have the required data analytics tools. However, this global estimate takes into consideration the time that would be spent on the data analysis and reports by all the teams.

How much does your company invest in data analytics today?

Today’s cost of investing in data analytics depends on varying factors. These factors include:

  • available tools,
  • the severity of support,
  • and analytics. 

If you need to make data-driven decisions that are sufficient to provide long-term growth, then you must spend a considerable amount on data analytics.

However, investing or the intention of engaging the data analysis capacities is not sufficient in itself. 

Various options are available for consideration when engaging in data analytics, and all of this depends on your company. Thus, the human cost, services, and tools have to complement each other, as represented in the table below:

data-analytics-cost-simulation

Source

Human Cost

People are also crucial when conducting data analysis as the end goal is to influence the willingness of your customers. It is essential to look at how you source and enable the necessary talent. 

Thus, the human cost demands that you identify those who can help integrate data-driven activities within the organization.

Those who do it already have analytical skills in your company, and you can build their skills to reduce the cost of hiring experts. It involves adopting user-friendly training with tools that can be accessible to those trusted with the duties.

Small or medium-sized companies can use this to reduce human costs in the long run. Yet, you may need to get experts to start the process and train your in-house employees.

Services

Your company’s investment in data analytics has to place into perspective if it is a service acquired. There are agencies and other companies that take up the task of data analysis for other companies, which would be important in determining the cost for your SME.

For instance, you could contract a Customer Relations Management (CRM) agency to build some automated marketing workflows. In this case, the agency would spend enough time reconciling some customer data sources. It would help develop a certain level of customer knowledge to aid the analysis or some RFM segmentation and then move on to email workflows.

Just as the human cost, this workflow level would cost separately and play a vital role in your company’s money on data analysis.

Tooling

Specific essential reporting tools are used in data analysis suitable for your SME. Selecting one should begin with some popular reporting tools like Google Data Studio. The device is based on Gheet data and Google analytics, which have proven efficient in analyzing company data.

Companies still find simple BI tools helpful and purchase the Metabase or PowerBI, which leads to the next stage. The next step is to implement a basic data infrastructure with a data warehouse.

There is Google BigQuery and ETL software like Airbyte or Fivetran. These tools have licenses, and these cost differently while influencing how much your company needs to spend.

The cost of outsourcing data services vs. in-house data analysts/engineers/scientists

Data engineers cost differently based on the type of service they are offering. For many companies, an in-house data science team seems like the only option. Having a team of data analysts is ideal for big companies.

For small and mid-sized businesses, it isn’t an available solution. Most of these companies turn to outsource to start their data analytics journey.

Here is a breakdown of how much an in-house data science team costs vs. the price of outsourcing data services:

Data Analytics consulting firms

Using data analytics firms is known to be reliable due to several factors. Consultants are known for their experience in various industries. However, this makes it easier for them to deliver results faster.

An advantage of this is the level of commitment it requires compared to when having to hire a full-time employee. However, it is essential to note that these traditional consulting firms would cost approximately $50-100 per hour. In some cases, the costs are even higher, as the job would span through weeks or months.

So, engaging a consulting firm would require at least $2000 – $4000 for a week’s work. Even though this may be the first option for data analytics for your company, it may not be the most cost-efficient. It may not be a sustainable alternative as it relies on external factors.

Outsourced data analytics freelancers

Freelancers can serve the same function as consulting firms but with a lower price due to the workforce needed. It could be a single freelancer with enough experience to help analyze your company’s data. 

In most cases, it is still reliant on the project’s scope as it drives the cost of the analysis.

The project would be short-term, just as found in traditional consulting firms, which means minimal commitment. Engaging freelancers would be estimated at $1000 per week, which is considerably affordable. Outsourced freelancers can also differ in their quality, and research is critical.

However, the return on investment (ROI) and value-added to the business can not be determined. Language and cultural barriers can be a problem with outsourcing freelancers as most are in places like China and India.

This could constitute friction between your company and a data analytics service provider. Though outsourcing freelancers may help reduce spending, you must consider the differences.

In-house data analytics team

With an in-house consultant, there is someone who is always on call and has been a part of the company for a while. This provides an opportunity to have someone who is considered an outsider handling the company’s analytics. The only necessity for this to work is training the employee to understand your business and industry context.

Compared to working with consultants, this reduces the level of friction with delegated tasks. 

Finding the right analyst can be time-sensitive, obstructing the quality of service provided. 

The hiring process can also be tedious and require a commitment to ensure that you find the perfect fit.

There are equal concerns that full-time analysts may become redundant during the offseason. The minimal cost of keeping an in-house specialist is approximately $60,000 compared to what other data analysts cost.

overview-of-salaries

Some may even argue that the process of hiring and integrating a new employee is for this reason. Though this is a reliable option, it would still cost the company much more.

Wrapping up

Data is critical in scaling up your business as it helps establish behavior patterns. Customer behavior, needs, and data acquired throughout running a company all contribute to the data that is to be analyzed. It improves the innovativeness of a business and provides a basis for more data-driven decisions.

These data analytical processes can be done by either an outsourcing firm, a freelancer, or an in-house team for a small or medium-sized company. Each of these options has its advantages and disadvantages. Some are more expensive than others, so they cost differently based on the budget set aside for data analytics costs.

However, companies should set aside approximately 2-6% of their total budget for data analytics. 

Data Operation tools such as Octolis can significantly lower the overall cost of data analysis. Octolis has an intelligent marketing database that would allow you to integrate your data sources and CRM tools or marketing automation.

Try out the Octolis Data Operation Tool!

How to hire your first data analyst?

Businesses deal with a ton of data every day. They use data to identify inefficiencies, opportunities, and more. However, when aggregated, data is raw and meaningless. It is insight from aggregated data that is meaningful to organizations.

A data analyst turns raw data into valuable insights that businesses need to make critical decisions. 

However, hiring a data analyst is not a walk in the park. If you get it right, your data become great assets helping you make sound business decisions. But, if you get it wrong, your data will be anything but an asset.

This article will help you get it right when hiring a data analyst. It’s a detailed “how to hire data analyst” guide that treats:

  • Identifying who you exactly need
  • Data analyst hiring process
  • How to get the best out of your data analyst.

Identifying who you exactly need

The recipe for failure is putting “a square peg in a round hole.” So, the first step to hiring the first data analyst is identifying who you exactly need. 

You need someone who fits into your organization’s needs and direction. The main discussion is whether the data analyst is required for a one-off project or on an ongoing basis. This will determine whether you should hire a part-time or full-time data analyst.

A part-time analyst will serve you if your needs include developing a particular model or analyzing a specific data set. But if your needs are making sense of a continuous inflow of datasets, you should hire a full-time data analyst.

When to hire a data analyst

data analytics startups etapes

Source: thinkgrowth.org 

Your business starts dealing with data from day one. However, you don’t need a data analyst from those foundational days.

Data analysts command good salaries, and the limited resources you’ll have when starting your business should not go into hiring a data analyst. Also, this is the stage where you’ll be closest to your business, so you should be able to make good decisions based on your instincts.

Hiring a data analyst may also not be efficient even when your business has grown to 10 – 20 employees. You’re still not big enough to justify investing in building data infrastructure and hiring a data analyst. Instead, hire workers who can use the built-in reporting capabilities of your SaaS products.

When you’ve grown to 20 – 50 employees, you should bring a data analyst on board. With data coming from everywhere, you need a central team to make sense of them. First, you need to build your data infrastructure and then hire an analyst lead.

What to expect from your first data hire

Your first data analyst hire should be someone who is a merger of a data analyst and analytics engineer.  

This is because when making your first hire, you’ll either not have a data infrastructure or will be in the process of building one. So, you need someone who’ll evaluate data to report on the state of business and build some of the foundations of the data warehouse.

What your first data analyst hire will do

Your first hire will do the following:

  • Data Analysis
    • Investigate trends
    • Do ad-hoc analysis
    • Build simple dashboards to display and analyze data 
    • Report on the state of the business
  • Analytics Engineering
    • Own the data warehouse
    • Develop data models that’ll be used for analysis 

data analytics startups data analyst vs data engineer vs data scientist

Source: abartholomew.com

What skills should your first data analyst hire have?

To effectively perform “analysis + analytics engineering” responsibilities, your first data analyst hire needs the following skills:

  • Business understanding. This is a no-brainer. The person needs to understand what the business is about, including its goals and KPIs. This is the only way to know what insights are valuable. 
  • Data modeling. Data modeling sets data standards for the organization. So, the person needs to know how to create data models that clearly show the organization’s relevant data elements and the connections between them. The person should be able to create visual representations of what data will be captured, how it will be stored, and how the individual data elements relate to the various business processes. 
  • Knowledge of SQL. Structured Query Language (SQL) is the standard querying language for all relational databases (like Oracle, Microsoft SQL, MySQL, etc.). To extract data from these databases, you need knowledge of SQL. Thus, SQL is a minimum requirement for data analysts.
  • Use of data ingestion tools. As a data analyst, you’ll need to transport data from different sources to a target site for evaluation and analysis. Data ingestion tools facilitate this by manually eliminating the need to code individual data pipelines for every data source. So, your first data analyst hire should be comfortable with using data ingestion tools or should be able to learn how to use them quickly.

How senior should your first data analyst hire be

As mentioned before, your first data analyst hire would perform analytics engineering responsibilities. Also, the person should be someone that will eventually lead your team of analytics professionals.

So, this should not be a starter analyst with minimal experience. Instead, they should be senior analysts with solid expertise in laying the foundations of a data warehouse and building and leading a data analytics team. 

Someone with that profile should have more than the minimum bachelor’s degree and have at least four years of experience.

Data Analyst hiring process decrypted

Attracting the right people is usually a challenge when you need to fill a position. It is even more challenging if the job is technical like that of a data analyst.

Below we decrypt the process and show you how to get the right data analyst. This will be discussed under three subheadings:

  • How to structure your analyst job description
  • What to do beyond the sharing the job offer
  • How to interview data analyst candidates

Structure your data analyst job description

Attracting strong data analyst candidates starts with posting a strong job description. Essential elements of a strong data analyst job description are:

  • Background of the role
  • Requirements for the role
  • Responsibilities of the role
  • Hiring Process
  • 30/ 60/ 90 day plan

1. Background/ Overview

In this part of the “job description,” briefly state your organization’s business and your goals for the role you are filling. The overview is what sells your organization to the candidates.

An excellent example of an overview is:

[Name of the company] is a company that specializes in the creation of multi-discipline business platforms with specialist partnerships for value co-creation in each of the different business segments through modern co-petition business principles.

2. Requirements for the role

This is where you list the hard and soft skills you need in a candidate. It should include desired educational qualifications, certifications, and technical skills.

A good example is:

Requirements for the role sample

Source: Indeed

3. Responsibilities of the role

Here, state what you expect the data analyst to do in the role. While it is impossible to cover everything, you should be as specific as possible.

A good example is:

Responsibilities of the role sample

Source: Getdbt

4. Hiring Process

Mention the different stages in your hiring process, from submitting applications to the interview (and beyond, if applicable). Mention what each step will involve and how long it’ll take. Candidates usually appreciate this because no one likes to be kept in the dark.

An example of this is:

Hiring process sample

Source: Getdbt

5. 30/ 60/ 90 day plan

This means clearly stating your expectations of the person in 30, 60, and 90 days on the job. It helps set standards for performance.

An example of this is:

Day plan sample

Source: Getdbt

Sharing the best job offer is not enough

While creating a great job offer is essential to attracting talents, even the best job offer does not guarantee to get the best talents.

This is because posted job offers are usually open to every Tom, Dick, and Harry. This is not that the Toms, Harrys, or Dicks will not make good analysts. It simply means that narrowing the search often produces better results.

Here are a few tips to go further in your research and find the best data analysts where they are 🙂

1. Visit data analysts’ communities

In the modern era, people with similar interests form communities to curate and share content. Interestingly, there are different data analyst communities. Simply reaching out to these communities can enliven your search.

Some popular online data analyst communities are:

  • Kaggle – a data science and machine learning community. 

Kaggle

Source: Kaggle

  • StackOverflow – a question and answer online platform for data scientists, system admins, mobile developers, game developers, and more.

StackOverflow

Source: Stackoverflow

Interestingly, data analyst communities are not only virtual. In addition to the online forums, they often hold offline meetups. Attending one of these seminars could get you “your man.”

2. Look at projects 

A good data analyst resume does not make one a good data analyst. The only way to tell that someone has the technical competencies mentioned in their resume is to evaluate projects that person has done.

Thankfully, you do not need to visit the person’s previous employer for this. There are many public resources that data analysts can use to showcase projects. An example is Kaggle.

There are different Kaggle competitions where analysts are tasked with solving data science problems. Host a Kaggle competition and see what the various data analysts do.

3. Look for storytellers

Storytelling means showing how insights from data relate to people and scenarios and galvanizing support for particular recommendations.

It is crucial because data analysts do not only munch numbers but they interpret data to inform decisions. Unfortunately, sometimes even the best facts do not sway people. Instead, you need to connect with people’s emotions to get their buy-in.

Conduct an interview for data analyst candidates

When conducting interviews for data analyst candidates, ask questions that reveal the person’s hard skills, behavioral skills, and soft skills.

1. Hard skills

Hard skills refer to the technical knowledge and abilities of the candidate. Relevant questions to reveal the technical abilities of data analysts candidates include:

What statistical tools and database software have you used previously, which do you prefer and why?

Why this matters:

Data analysts will apply statistical analysis to data. You need to know that they can do this.

What to listen for:

  • Knowledge of the main data language SQL
  • Use of other analysis software like SPSS
  • A willingness to learn new software

2. Behavioral skills

Behavioral questions show how the candidates handled situations in the past. An excellent example of a behavioral question to ask a data analyst candidate is: 

Describe a time when you designed an experiment. How did you measure success?

Why this matters:

Data analysts conduct experiments to determine whether an action will be successful, thereby saving their organizations from taking doomed steps. This question tells you if the candidate understands the concept of experiments.

What to look out for:

  • Outlining clear objectives of the experiment
  • Ability to design metrics and use these to measure results

3. Soft Skills

Soft skills refer to the candidate’s personality traits. An example of an excellent question to ask data analyst candidates to reveal personal traits is:

What do you think are three personality traits that data analysts should have, and why?

Why this matters:

Data analysts need more than technical abilities. In answering this question, candidates will often mention attributes that they possess. So, the question tells you more about the person. 

What to look out for:

  • Appreciating that certain personality traits are as crucial to a data analyst as technical skills
  • A mention of some of the most critical soft skills, like attention to detail. 

How to get the best of your first data analyst

Hiring the right data analyst is good, but it is even better if the person delivers well.

One way to do this is to set clear expectations using the 30/ 60/ 90 days plan. That is, clearly define what you expect the data analyst to be doing (or have done) after 30, 60, and 90 days on the job. Then review these with the data analyst periodically to determine how performance is stacking up.

30/ 60/ 90 days plan

Source: Getdbt

30 days expectations

Since the first 30 days is still “early days” for the data analyst in the organization, expectations should center around:

  • Familiarization with the company’s business and values 
  • Understanding reporting and insight needs
  • Extracting data from different sources and loading it into the data warehouse

60 days expectations

By the end of the second month in the role, the data analyst should have understood the business. So the analyst should have:

  • Have created dashboards covering important KPIs.
  • Be in the process of developing a data model.

90 days expectations

By the end of the third month, the data analyst should be very mature in the role. The analyst should:

  • Have completed the first version of the data model.
  • Be able to build a data source from scratch and easily build analysis.
  • Be able to answer questions for business users easily.

Wrapping up

You need a data analyst to make sense of your business data and give you insights that’ll help you make the right business decisions. Key takeaways from this detailed article about “how to hire a data analyst” are: 

  • You may not need an analyst until you have 20 – 50 employees and have data needs that justify building data infrastructure.
  • Your first data analyst hire should not be a junior analyst but a senior with expertise in building infrastructure and leading teams.
  • To attract strong data analysts, important elements to include in the job posting consist of the “hiring process” and “30/ 60/ 90 days” plan.
  • Posting a good job offer does not guarantee to get the right analyst. You need to narrow your search by visiting data analyst communities and evaluating projects.
  • In interviews for data analyst candidates, ask questions that reveal hard skills, soft skills, and behavioral elements.
  • After hiring, to get the best out of your data analyst, use the “30/ 60/ 90 days” plan to set clear expectations.

LTV – Definition, calculation, and use cases of Lifetime Value

There is a huge paradox around lifetime value: it is undoubtedly the essential business indicator, especially in e-commerce…but only a minority of businesses use it. 

According to an English study, only 34% of marketers say they know what lifetime value means. When you realize everything you can do with this indicator, it’s to die for. And it’s not just about measurement and reporting but, more importantly, about activation potential.

So, if you want to increase your income, you must calculate and use the lifetime value.

Let’s find out together what lifetime value is and, more importantly, how to use it intelligently to maximize your client assets.

What is Lifetime Value or LTV?

Definition

Lifetime value is a business indicator that estimates the amount of revenue generated by a customer over its entire lifetime.

This indicator lets you know how much a customer earns you throughout their relationship with your company, from their first purchase until the moment they end the relationship.

If a client generates an average of 50 euros in revenue per month and remains a customer for 3 years, their lifetime value will be 50 x 12 x 3 = 1,800 euros. The lifetime value is a monetary value, so it will be expressed in euros, for example.

Lifetime value is also called “customer lifetime value,” but more rarely. The acronym LTV (or CLTV) is very common.

A few clarifications should be made: 

  • The lifetime value is the sum of the average revenue (i.e., the margin) generated by a client throughout their life. BUT, sometimes turnover is used instead of income.
  • The lifetime value is an estimate. By definition, it is not possible to determine the lifetime value of Mr. Dupont before he has ended his relationship with your company. However, it is possible to estimate his lifetime value based on his profile, the data available to your IS, the lifetime value of the customer segment to which he belongs, etc.
  • The lifetime value can be calculated at several levels: at the global level (all your customers), at the level of a customer segment, or even at the level of each customer.

Lifetime Value is a key indicator in business sectors where controlling acquisition costs is crucial. This concerns in particular:

  • Subscription business models, SaaS businesses, for example. 
  • Retail and E-commerce.

Focus on 4 Lifetime Value use cases

Here are some typical LTV use cases. The list is far from being exhaustive.

Use case #1 – Determine the target customer acquisition cost (CAC)

Estimating how much a given customer will bring you in total allows you to assess the maximum marketing and sales investments to acquire that customer. The underlying idea is that it is absurd to spend more to acquire a customer than the revenue that customer will bring to the company.

If you know the client will earn you an average of $10,000; you can justify investing $3,000 to convert them. Marketing and sales efforts should always be commensurate with the revenue expected.

Along the same lines, you can use LTV to identify the break-even point, where the revenue generated exceeds the cost invested.

The LTV / CAC ratio is very important.

If the ratio is less than 1, the activity is not viable. When the ratio is greater than 3, it is an excellent sign, provided it is stable.

Ratio LTV CAC
Source: Ecommerce Finance Model Valuation

Use case #2 Target the most profitable customers first

We assume that you have already built a customer segmentation. If so, then LTV is one of the most relevant metrics to gauge the value of each segment. We strongly encourage you to calculate the LTV of your different segments. This way, you will identify your best segments. You can then imagine specific actions for these VIP customers, remembering to pamper them!

In this case, just as before, the Lifetime Value indicator appears to be an excellent tool for optimizing marketing efforts and investments.

The Lifetime Value allows you to assess who your best customers are!

Octolis

Use case #3 – Identify your weak points and areas for improvement

All the work required to calculate the Lifetime Value will help you identify weak points or at least areas for improvement in your business. The use of Lifetime Value induces a resolutely “customer-centric” way of thinking that can only enlighten you on many things! For this reason alone, and in the process of continuous improvement, calculating the Lifetime Value of your customers and your segments is worthwhile.

Use case #4 – Plan your annual advertising budget

This ties in with what we said above. If you know your LTV, you can more easily and more accurately determine the budget to invest in acquisition, advertising campaigns, etc.

How to calculate LTV?

Now that you know the definition of Lifetime Value and its possible uses, let’s see how you can calculate it.

Is there a single LTV calculation formula?

No, there are several formulas to calculate the Lifetime Value for two reasons:

  • We saw in the first part that the variable used to build this indicator could be the margin or the turnover. This leads to different calculation formulas.
  • The calculation formula also depends on the business model of the activity. This needs some explaining…

The formula for calculating LTV, in a way, will always be:

[What a customer earns me per month] X [Customer Lifetime].

But the calculation of the first variable of the formula ([What the customer earns me per month]) is directly linked to the business model of the activity. In an e-commerce activity, what a customer brings me is calculated by the formula Average shopping cart X Purchase Frequency. In a subscription business model, the calculation is more straightforward: it is the price of the subscription.

Is it easier to calculate LTV from margin or turnover?

Calculating Lifetime Value using turnover is much easier. The calculation of the LTV from the margin is more complex, but it is the only one to allow an estimation of the financial performance.

What is the formula for calculating LTV in E-commerce?

In e-commerce, the Lifetime Value formula is as follows:

LFT = (Average Shopping Cart + Frequency + Gross Margin) / Churn Rate

Each element of this formula is itself an indicator with a calculation formula.

Average Shopping Cart

This is the turnover divided by the number of orders. A company that generates a turnover of €1,000,000 and has 30,000 orders has an average shopping cart of: 1,000,000 / 30,000 = €33.

Purchase frequency

Purchase frequency is calculated by dividing the total number of orders by the number of (unique) customers. If you have 1,000 orders per year and 50 customers, the purchase frequency is 1,000 / 50 = 20.

Gross margin

Gross margin is turnover minus purchase costs, divided by the turnover then multiplied by 100 to obtain a percentage.

For example, if you buy a product for 50 euros and resell it for 100 euros:

Gross margin = (100 – 50) / 100 = 0.5. → 0.5 x 100 = 50%. You make 50% gross margin.

Churn rate

The churn rate, or attrition rate, calculates the loss of customers over a period of time. It is calculated as follows:

Churn rate = (Number of customers at the end of the period – Number of customers at the start of the period) / Number of customers at the start of the period.

Again, multiply the result by 100 to get a percentage.

Let’s take an example. You want to calculate the attrition rate between January 1 and February 1. You had 110 customers on January 1, and you have 80 on February 1. Your attrition rate is equal to: (80 – 110) / 110 = – 0.27.

How to improve the Lifetime Value in E-commerce? (4 practical tips)

Improving lifetime value should be one of the main objectives of any e-commerce business. How to achieve it? To answer this question, we must assess each of the terms of the equation. Improving lifetime value involves improving one or more of the variables of the calculation formula that we developed earlier. This means:

  • Improve the average shopping cart and/or
  • Increase the purchase frequency and/or
  • Increase the gross margin and/or
  • Decrease the churn.

Here are 4 tips to improve each of these variables without claiming to be exhaustive. These are a few avenues to explore…

1. Improving the average shopping cart

Improving the average shopping cart means customers should place higher orders. How? By encouraging them to add more products to their cart. How? By offering them, during the buying journey, complementary products. This is called cross-selling. Another option is to offer customers higher-end products. We then speak of up-selling, widely used in the world of services and retail.

Here are some ideas to consider:

  • Offer personalized products on the site, make product recommendations based on customer preferences. This implies, of course, that the visitor browsing the site is a known visitor.
  • Send personalized email campaigns offering product recommendations based on purchase history and/or other information about your customers (purchase preferences, socio-demographic information, etc.).
  • Highlight complementary or similar products during the buying journey, depending on the products added to the cart.
  • Create product packs.
  • Offer delivery beyond a certain purchase amount.
  • Create a loyalty program to incentivize customers to buy more to earn points/rewards.

2. Improve the purchase frequency

You may have customers who buy a lot, have a large average shopping cart, and buy infrequently…or less often than you would like. There are different techniques to encourage customers to buy more often and thus increase their purchase frequency. But they essentially boil down to one thing: creating email or mobile campaigns and scenarios (and even postal direct marketing, if you use this channel). We think of promotional campaigns or abandoned cart relaunch scenarios (the abandoned cart relaunch is a great way to increase lifetime value!).

We are entering here into the mysteries of relationship marketing, into the relationship plan… By communicating regularly and relevantly with your customers and maintaining a customer relationship with them outside of purchasing times, you will be able to make them more loyal customers who purchase more. The subject is vast. We invite you to discover the complete guide to the relationship marketing plan published by our friends at Cartelis.

3. Improve gross margin

To increase gross margin, you have two levers:

  • Increase prices.
  • Reduce product purchasing costs.

Here are two ways to increase the gross margin:

  • Use an inventory manager to estimate your restocking needs correctly and limit inventory to what is necessary while avoiding the out-of-stock risk (fatal in the e-commerce sector, where customers want to have everything right away).
  • Market high-margin products. It’s simple and logical! The margin rate varies enormously from one product to another. You must identify and market products with a high margin rate while remaining in your universe. You can also highlight in your communications the products with the highest margin rate (see the product recommendations we were talking about above).

4. Reduce the churn rate

The churn rate is a very complex metric. There are many reasons and factors that can lead a customer to stop buying from you. There are no secrets to reducing churn: you need to increase customer retention, customer loyalty. This involves:

  • The implementation of a concrete relational plan,
  • A constantly renewed understanding of the needs of your target, to constantly adjust your offers in line with customer expectations,
  • The improvement of the customer experience at all stages of the customer journey: improvement of the website, optimization of customer service, improvement of the services offered to the customer…

How to calculate the Lifetime Value using a Customer Data Platform?

Calculating and monitoring the Lifetime Value requires having aggregated, consolidated, unified data. The calculation formula presented above clearly highlights this need: you should have a clear knowledge of the average shopping cart, purchase frequency, gross margin, customer status, customer preferences, etc. But this knowledge is not enough; it still has to be unified, brought together in the same system. For this reason, our last advice is to invest in a solution for the unification of customer, transactional and financial data…

It is impossible to reasonably implement a strategy based on Lifetime Value without having a Unique Customer data Repository. Customer Data Platforms represent the modern solution for consolidating and unifying customer data (in the broad sense of the term, including transactional data, etc.).

With this type of solution, you can efficiently (and easily) calculate the lifetime value and use it to segment and personalize your relational marketing. Why “easily?” Because with a CDP, you have all the variables of the lifetime value formula in one place. Lifetime values ​​can be calculated automatically in the CDP once you have collected all the necessary data.

In short: with a CDP, you can connect all your data, calculate the Lifetime Value, and send the calculated segments/aggregates to your activation tools to better communicate with your customers…and increase their Lifetime Value.

Octolis offers a modern CDP solution to truly leverage your customer base
We’ve published a comprehensive guide to Customer Data Platforms if you want to learn more.

Conclusion

In e-commerce, there are many opportunities to maximize revenue. Client assets are generally underutilized. The Lifetime Value is one of the best indicator to help you increase the income of an e-commerce activity while remaining resolutely customer-centric. We have seen what it is, how to calculate it, why to use it, and how to improve it. Now, it’s up to you!

9 customer segmentation examples and methods

Customer segmentation is a very powerful tool, but the reality is that few marketers use it properly.
It’s not enough to play with a few filters in Mailchimp or Salesforce. Customer segmentation is a complex process that requires a clear vision of the marketing objectives, the key personalization axes, the methodology for monitoring segmentation incremental impacts, etc.

First and foremost, you need to understand the state of the art.
Unless you work in a large company, or a very mature scaleup, the first step is to know the subject’s best practices and adapt them to your business.
We have prepared a complete article on customer segmentation, including 9 examples of classic customer segmentation to inspire you.

What makes a good customer segment?

A good segmentation should include these 6 characteristics:

  1. Relevant: it’s usually not profitable to target small segments – so a segment should be large enough to be potentially profitable.
  2. Measurable: Know how to identify customers in each segment, keep control of customer data,  and measure their characteristics such as demographics or consumer behavior.
  3. Accessible:  It sounds obvious, but your business should be able to reach these segments through different communication and distribution channels. For example, if your business targets young people, it should have Twitter and Tumblr accounts. You should also know how to use them to promote your products or services.
  4. Stable: To maximize the impact of your campaigns, each segment must be stable enough for an extended period. For example, the standard of living is often used as a means of segmentation, but this is dynamic and constantly changing. Therefore, it is not necessarily wise to make a segmentation based on this variable at the global level.
  5. Differentiable: People (or organizations in B2B marketing) in one segment should have similar needs, and these would be different from those of people in other segments.
  6. Actionable: This implies being able to deliver products or services to your segments. An American insurance company spent a lot of time and money identifying a segment and then realized it couldn’t find any customers for its insurance product in this segment. And it wasn’t able to devise a strategy to target them either.

The classic dimensions of customer segmentation

GeographyDemographic (B2C)Demographic (B2B)PsychographicBehavioral
ContinentAgeSectorSocial classUsage
CountrySexNumber of employeesLiving standardsLoyalty
StateAnnual revenueDigital maturityValuesSensitivity to XYZ
RegionSocio-professional CategoryFinancial situationPersonalityPurchase frequency
DepartmentMarital statusShareholdingConvictionsPayment method
CityStudy levelMarket capitalizationSocial networksConsumption habits
VilleJob TitleBusiness modelHobbies
DistrictLanguageTechnologies used
ClimateReligion

Customer segmentation is divided into 4 main categories:

  • Geographic segmentation: It groups customers according to their location. Where they live, work, or go on vacation, for example.
  • Demographic Segmentation: It groups customers using characteristics such as age, gender, income, or industry.
  • Psychographic Segmentation: It groups customers according to their psychological characteristics, such as their interests, opinions, or social status.
  • Behavioral Segmentation: It groups customers based on their buying behavior or customer journey stage. Customers who spend a lot, those who buy at a discount, or those who are at risk of changing their minds, for example.

9 exemples actionnables de segmentation client

1. SML segments (Small, Medium, and Large)

SML segmentation is based on Pareto’s law, which states that 20% of your customers generate 80% of your turnover. Therefore, you should primarily focus your efforts on this minority of customers.

This segmentation divides customers into three segments:

  • Large customers: who represent a small part of customers but a high percentage of turnover.
  • Average customers: who are few and represent a significant share of turnover.
  • Small customers: the mass that represents only a moderate, even small part of your turnover.

Once these three segments have been determined, it is necessary to identify their commonalities and understand their expectations to fulfill them in a specific way. Your marketing strategy (message, communications frequency, promotional offers, etc.) will differ based on whether you are targeting small or large customers.

The more customers represent a significant part of your turnover, the more you will personalize your communication to offer them an exceptional customer experience using marketing automation software.

2. Promophilia

Promophilia designates the category of buyers responsive to promotions. The search for the right deal is their primary motivation. These are the famous “coupon lovers.”

This is a behavioral segmentation criterion. They spend a lot of time surfing the web to find the cheapest product. If you want to prioritize this type of consumer, you should set up loyalty programs.

The objective is to define segments based on responsiveness to promotional campaigns. For example, those who bought your product with a coupon in the last X days.

3. Stages in the customer journey

Customer journey phaseSegmentDefinition
ConversionPotential customersContacts who have not yet made a purchase but have shown interest in one of your acquisition campaigns.
GrowthFirst-time buyersCustomers who have only bought once and who need to be turned into repeat buyers.
LoyaltyRepeat customersCustomers who have made at least two separate purchases over time.
RetentionLoyal customersCustomers who have purchased multiple times in a short period of time.
Re-conquestRepeat customers at riskCustomers who have purchased several times but have not purchased anything for a long time.
AttritionInactive repeat customersThe loyal customers you have lost.

You can thus create 6 different customer segments:

  • Potential customers (prospects): these are contacts who have not yet made a purchase but have shown interest in one of your acquisition campaigns. You have to bring them to a first conversion with retargeting campaigns, coupons to play on FOMO to accelerate conversion, educational content to convince, etc.
  • First-time buyers (the new “real” customers): these are customers who have only bought once and who need to be transformed into repeat buyers. You have to remind them of your existence via product recommendations, educational content, or a request for an opinion on the first product purchased.
  • Customers who have purchased at least twice (repeat customers): these are buyers who have made at least two separate purchases over time. You have to nurture a dialogue to keep them and make them your ambassadors. Encourage those customers to make new purchases with offers on new products, a reorder form or even exclusive coupons.
  • Loyal customers (your best customers): these are the customers who have purchased several times in a short period. Your ambassadors have demonstrated their attachment to your brand and its products. To maintain their loyalty, involve them in your product innovation process. You can give them early access to your new offers or send them requests for customer reviews.
  • At-risk repeat customers: these are customers who have purchased several times but have not purchased anything for a long time. Recover them by sending them positive messages about your products, a coupon with a limited period of use, or even a questionnaire with an incentive.
  • Inactive repeat customers: these are the loyal customers you have lost. You should reactivate the relationship and renew the dialogue by sending large product promotions or a questionnaire like: “How can I help you?”.

Source: Dolist

4. Customer satisfaction and NPS

The Net Promoter Score (NPS) is the indicator of customer satisfaction and loyalty. It measures the likelihood that your customers will recommend your brand, products, or services. According to the score given by the customer, the latter is classified into one of the following 3 categories:

  • Promoters (score of 9 or 10)
  • Passives (7 or 8)
  • Detractors (0 to 6)

The NPS segmentation induces homogeneity between each segment of customers, but this is not always the case. Not all detractors are equal. A detractor of 0 may not necessarily ruin your reputation, but they may be likelier to complain about your business than the customer who gave you a 6 rating.

This also applies to your promoters and passives. Not all of your promoters are promoting, and some passives may not be so passive after all. A study revealed that customers who give ratings of 8, 9, or 10 were all similar in terms of recommendation probability.

So focus on passives who give you an 8 rating to boost customer recommendations. On the other hand, there is a significant difference between a rating of 7 and 8, or between 6 and 7 in terms of recommendation probability.

You can develop different strategies for detractors who have given you a rating of 6 to convert them into promoters. Pay attention to satisfying your passives to give them the little nudge necessary to become promoters. Use NPS to boost customer recommendations.

5. RFM Segments (Recency, Frequency, Monetary value)

RFM segmentation is one of the most popular customer scoring systems based on previous purchases. Direct marketers use it to score each customer and predict each segment’s reaction to future marketing campaigns.

From the RFM analysis, we can draw 6 segments:

Customer segmentRFMDescriptionMarketing action
The hardcore - Your best customers111Highly engaged customers who have purchased your products recently, most often, and generated the most revenue.Focus on loyalty programs and new product launches. These customers have proven they are willing to pay more, so don't offer discounts to generate additional sales. Instead, focus on high value actions by recommending products based on their previous purchases.
The loyal - Your most loyal customersX1XCustomers who buy most often from your store.Loyalty programs are effective for these repeat visitors. Engagement programs and evaluations are also common strategies. Finally, consider rewarding these customers with free shipping or other such perks.
The whales - Your highest paying customersXX1Customers who generated the most revenue for your store.These customers demonstrated a strong willingness to pay. Consider premium offers, subscription levels, luxury products, or value-added cross-selling or upselling to increase total added value. Don't lose your margin with discounts.
The Promising - Loyal customersX13, X14Customers who come back often, but don't spend a lot.You have already succeeded in creating loyalty. Focus on increasing monetization through product recommendations based on past purchases and incentives tied to spend thresholds (set based on your store's average added value).
The recruits - Your newest customers14XNew buyers visiting your site for the first time.Most customers never become loyal. Having clear strategies for new buyers, such as welcome emails, will pay off.
The unfaithful - Once faithful but now gone44XGreat old customers who haven't bought in a long time.Customers leave for a variety of reasons. Depending on your situation, suggest price offers, new product launches, or other loyalty strategies.

6. Customer (in)activity

At a minimum, most companies classify customers into two categories: active customers and inactive customers. These categories indicate when a customer last made a purchase or engaged with you for the last time. For non-luxury products, active customers are those who have purchased in the last 12 months (and vice versa for inactive customers).

To segment the customer base according to the level of activity or commitment, we sometimes use a Recency Frequency Engagement scoring, like an RFM. Here, transactions are replaced by all forms of contact points (pages visited, email opening, email click, ..). We associate several points, for example, +1 email opening, +3 website visit, +5 email click, etc.

7. Purchase frequency

Active customers are your loyal customer base and brand ambassadors. They are more likely to share your posts, encourage others to buy your products, and leave comments.

Target these loyal customers with exclusive discount codes or a loyalty program to ensure your organic growth and multiply your organic reach online.

Loyalty programs are a great way to improve purchase frequency, as they effectively draw customers away from the competition by focusing their attention on your offers. By distributing loyalty points to customers, you motivate them to increase purchase frequency.

8. Customer value

This can lead to or be based in part on the RFM segmentation program.

The value of a customer is strictly determined by their cumulative spending. An LTV (Life Time Value) scale can be used to determine eligibility for offers, loyalty rewards, promotions, and other unique campaigns.

Building a customer score by giving a high or low value to each segment can help understand how high-value customers find you in general. Therefore, you can know how to direct your acquisition strategies.

9. Acquisition sources

In their buying journey, potential customers are likely to interact with your company through multiple acquisition channels, especially when developing an omnichannel customer relationship.

Analyzing these results allows you to be strategic and invest where it pays off. In addition, the source of acquisition can be very structured in explaining customer behavior thereafter.

We can even go so far as to segment by acquisition cohort to observe the behaviors induced by certain campaigns in the medium term.

Referred customers are 4x more likely to refer others to your brand. Segmenting your audience based on whether they were recommended or not is an effective approach to improving your referral sales.

Target your current customers who have joined your referral program and develop campaigns to turn them into super fans.

From segmentation to personalization

Source: Formation

Segmentation is a solid foundation, but it doesn’t offer everything you need to develop personalized offers and build strong relationships with your current customers.

Segmentation is an excellent working basis for customer data, but it only offers a general view of the customer. You should personalize your loyalty offers or messages even further. It will help you target and tailor messages and offers to different customers based on their unique wants, motivations, and needs.

This is why segmentation is often referred to as stage 1. Personalization (into 1-10 segments) and micro-segmentation (10-30 segments) as stage 2.

Many brands get stuck at these basic stages and thus limit their ability to develop deeper and more profitable relationships with their customers. To move to step 3, you have to go beyond segmentation’s limits to find the best alternatives.

Marketing teams must leverage artificial intelligence (AI) and machine learning (ML) algorithms to achieve true personalization. These advanced technologies help to continuously capture and analyze every interaction a customer has with your brand. With these analytics, businesses can individualize offers and messages to specific customers at scale.

For example, Starbucks, which has more than 30,000 stores and nearly 19 million active members of its rewards program, aims to be the most personalized brand globally. The company currently uses AI to continuously learn its customers’ preferences and desires based on purchases and interactions.

AI and machine learning capabilities have enabled Starbucks to create individualized loyalty offers at scale. The results have been phenomenal: 10x the speed of marketing execution and three times the one-to-one marketing and sales drive.

Therefore, segmentation alone is far from providing the value of true personalization and information with the same level of sophistication or detail. Nor can it deliver targeted, personalized messages to a huge volume of unique customers.

Customer scoring: Definition, examples, and method in 5 steps

Customer scoring helps you prioritize your marketing budgets for the customers most likely to buy. It also helps segment your customer file better to obtain greater performance in your campaigns.

For instance, it will help you identify your most persuasive promoters and make them your champions.

In this article, we present 3 concrete examples of customer scoring models. We also offer you a 5-step guide to building a customer scoring that is effective and quickly usable.

Definition of Customer Scoring

Definition

Customer scoring involves assigning a score to each customer of an organization. This score can have an analytical objective – for example, to estimate a customer’s value (LTV – Lifetime value). It can also have an operational purpose: to delimit customer segments and decide on the marketing actions to be carried out.

Companies use these value analysis methods to define which customers are sources of significant profits. The goal: use the information collected to communicate effectively with these most valuable segments. The RFM (Recency, Frequency, Monetary) model is one of the most commonly used methods.

The main advantage of the RFM method is that it gives detailed information about these customers using only three criteria. This reduces the complexity of the customer value analysis model without compromising its accuracy.

Customer scoring is not strictly limited to active customers. Inactive customers can turn out to be an essential segment of customer scorecards.

Scoring client VS Lead scoring

CriteriaCustomer scoringLead scoring
ObjectiveRetention, upsell, maximization of the LTV of existing customersAcquisition of new customers
OperationAnalysis of a stock (usually large) of past dataContinuous updating of a score in flow to each action of a prospect
Team concernedMarketingCommercial
ApproachDefinition of mutually exclusive segmentsGrading of prospects on a more or less linear scale

Lead scoring seeks to estimate the expected gain on a prospect with two types of variables:

  • An intention score: The probability of converting a prospect (lead) into a customer.
  • A potential score: The estimated value (expected LTV) of the prospect if they become a customer.

It is mostly used in B2B to help sales teams maximize their expectation of gains. They prioritize leads with the most significant potential and the strongest purchase intention.

Instead, customer scoring aims to segment an existing customer base (stock) into mutually exclusive segments. The principal challenge is not prioritizing the segments to be worked on but defining appropriate marketing actions that will maximize customer value within each segment.

A straightforward example: imagine you offer a 10% coupon simultaneously to all your customers:

  • Some were already in the process of purchasing, and you will have lost 10% of sales.
  • Others were about to buy from the competition, and you will have reactivated them.
  • Others finally bought yesterday and will not respond to the offer.

Customer scoring helps target only the right segment (the 2nd in our example) and consider different actions for the other segments. For example, you can offer an upsell to the former and ask the latter for their opinion on their purchase.

Customer scoring and Pareto’s law

The RFM model is linked to the famous Pareto’s law, which states that 80% of the effects are the product of 20% of the causes. Applied to marketing, 80% of your sales come from 20% of your (best) customers.

The RFM Model: A Standard for Customer Scoring

Traditional segmentation methods used by market research firms before the advent of data analytics use demographic and psychographic factors to group their customers.

Researchers still use samples to predict the overall behavior of a population. This prevents the definition of precise segments.

These studies are done manually, depend on skilled researchers, and are subject to human error. Therefore, a sample can be incorrect for many reasons: an insufficient number of consumers, a bad ratio between the different populations, variable psychographic factors, etc.

RFM segmentation is one of the most popular tools for rating customers based on their previous purchases. It is especially used by direct marketers.

With this RFM analysis, they can not only score each customer (which is very useful in its application later) but also predict the behaviors of each segment towards future marketing campaigns.

Campaigns can be planned more accurately and therefore become more profitable.

scoring client segmentation rfm
Source: Predicagroup.

Recency

How long has it been since the last purchase? The shorter the time, the higher the customer value.

The first step should be to divide the entire customer base into 3, 4, or 5 equal segments.

The maximum value is awarded to 20, 25, or 33% of customers who made purchases most recently. The minimum value is assigned to customers whose last purchase was made least recently.

Frequency

How often has the customer shopped at the store? The higher the purchase recurrence, the higher the customer value.

On a basis divided into 5 segments for the date of the last purchase, we again divide the customers into 5 equal groups according to the number of purchases they have made since the beginning of the relationship with your brand.

Monetary (Value)

How much did the customer pay in the store? Of course, the higher the spending, the higher the customer value.

Now it’s time to move on to the final part of the analysis – determining how much the customer spent on your products in total. As in the previous segmentation, it is recommended to use a scale of 1 to 3, 4, or 5 in this case.

The RFM model limitations

The main RFM limitation is that it does not allow the evaluation of the potential of a new customer because the seniority of customers is not taken into account. A customer who became a customer yesterday will have much less value than the oldest customers in this model.

3 examples of customer scoring

1. AnalyticsVidhya’s 3×3 RFM segmentation

scoring client segmentation rfm 3x3
Source: AnalyticsVidhya.

It is possible to group customers according to the 3 factors set out above. For example, group all customers whose seniority is less than 60 days in the same category. Similarly, customers with seniority greater than 60 days and less than 120 days in another category. We will also apply the same concept to Frequency and Value.

Vidhya themselves set ranges for each score based on the nature of the activity. Ranges for frequency and monetary values ​​will also be defined this way.

In this rating method, it is up to each company to establish the range it considers relevant for the recurrence, frequency, and monetary values. ​​Note, however, that ranges are not fractiles/quantiles.

The big advantage is that it is straightforward to set up. But calculating such a range for RFM scores also has limitations:

  • As a business grows, score ranges may need frequent adjustments.
  • If you have a recurring payment business, but with different payment terms – monthly, annually, etc. – the calculations are wrong.

2. Putler’s RFM segmentation

scoring client segmentation rfm putler
Source: Putler.
Customer segmentReferral scoreFrequency scoreDescriptionMarketing action
Champion customers4-54-5They bought recently, buy often, and spend the most!Reward them. They can be early adopters of new products. They will promote your brand.
Loyal customers2-53-5Often spend money with you. Respond to promotions.Sell ​​more expensive products. Ask them for opinions. Engage them.
Future loyal customers3-51-3Recent customers, but who have spent a lot of money and bought more than once.Offer a membership/loyalty program, recommend other products.
Recent customers4-50-1They have purchased very recently, but not regularly.Help them fit in, give them rewards fast, start building a relationship.
Promising customers3-40-1They are recent buyers but have not spent much.Create brand awareness, offer free trials.
In need of attention customers 2-32-3Fairly recent on average, they have an above-average purchase frequency and monetary value. They may not have bought very recently though.Make limited-time offers, Recommend based on past purchases. Reactivate them.
Passive customers2-30-2Below average in terms of novelty, frequency, and money. You will lose them if you do not reactivate them.Share valuable resources, recommend popular products / discounted renewals, reconnect with them.
At-risk customers0-22-5They spent a lot and bought often. But a long time ago. We must bring them back!Send personalized emails to reconnect, suggest new things, provide useful resources.
Indispensable customers0-14-5They made the biggest purchases, and often. But they haven't been back for a long time.Recover them with a renewal of the offer or by offering them new products, do not lose them to the profit of other competitors, talk to them.
Customers in hibernation1-21-2The last purchase is dated. They are the ones who spend little and have the lowest number of orders.Offer other relevant products and special discounts. Recreate brand value.
Lost customers0-20-2The recency, frequency, and money scores are the lowest.Rekindle interest with an awareness campaign, ignore it otherwise.

Quintiles work with any industry since the ranges are chosen from the data itself. They distribute customers evenly so that there is no overlap.

R, F, and M here have scores from 1 to 5, so there are 5x5x5 = 125 RFM value combinations. The three dimensions of R, F, and M can be represented on a 3D graph. If you want to determine how many customers you have for each RFM value, you need to look at 125 data points.

In this approach, one should plot Frequency + Money Score on the Y-axis (range 0-5) and Seniority (range 0-5) on the X-axis. This narrows down the possible combinations from 125 to 50.

It makes sense to put F and M into one combination, as both are related to the customer’s purchase volume. On the other axis, R gives us a quick look at levels of re-engagement with the customer.

3. Barilliance’s 4 RFM segments

scoring client segments rfm barillance
Source : Barilliance.

Note that the scores are reversed this time: 4 is the minimum value, and 1 is the maximum value.

Customer segmentRFMDescriptionMarketing action
The hardcore - Your best customers111Highly engaged customers who have purchased your products recently, most often, and generated the most revenue.Focus on loyalty programs and new product launches. These customers have proven they are willing to pay more, so don't offer discounts to generate additional sales. Instead, focus on high value actions by recommending products based on their previous purchases.
The loyal - Your most loyal customersX1XCustomers who buy most often from your store.Loyalty programs are effective for these repeat visitors. Engagement programs and evaluations are also common strategies. Finally, consider rewarding these customers with free shipping or other such perks.
The whales - Your highest paying customersXX1Customers who generated the most revenue for your store.These customers demonstrated a strong willingness to pay. Consider premium offers, subscription levels, luxury products, or value-added cross-selling or upselling to increase total added value. Don't lose your margin with discounts.
The Promising - Loyal customersX13, X14Customers who come back often, but don't spend a lot.You have already succeeded in creating loyalty. Focus on increasing monetization through product recommendations based on past purchases and incentives tied to spend thresholds (set based on your store's average added value).
The recruits - Your newest customers14XNew buyers visiting your site for the first time.Most customers never become loyal. Having clear strategies for new buyers, such as welcome emails, will pay off.
The unfaithful - Once faithful but now gone44XGreat old customers who haven't bought in a long time.Customers leave for a variety of reasons. Depending on your situation, suggest price offers, new product launches, or other loyalty strategies.

5 steps to build a customer scoring model tailored to your business

1. Collect and collate customer data

The RFM model involves analyzing customer transaction history. For this, it is important to always keep control of customer data. The first step is to extract the RFM data for each customer in ascending order.

It is also essential to choose a time interval to analyze the transactions – for instance, the last 12 or 24 months.

To limit the impact of the acquisition of new customers on data (for example, in a context of strong growth), we can decide to study an acquisition cohort. Therefore, you must analyze all transactional data of the last 3 months, but only for customers acquired more than a year ago.

2. Define RFM bearings

Companies need to create custom filters to segment customers effectively. You need to create sample filters for better understanding, like the example below. Be careful, however, because this is an important aspect that will vary depending on the nature of your activity.

scoring client palier rfm

You can now assign each customer a rating based on the table above. By doing so, you convert the absolute values ​​of transactions into blocks of similar transactions based on the RFM. Now you don’t need the absolute values ​​mentioned in parentheses anymore and just use the score for segmentation and analysis. After assigning scores, you can create groups of similar customers with the same or similar scores in all three criteria.

4. Name the segments

The labels used will be based on the different characteristics of the three ratings customers received. Since 5 scoring segments were used, and there are 3 criteria, there is a possibility of 5*5*5 = 125 unique segments.

You can decide how many segments you want to have. Having many segments helps to be more precise in the automation of marketing actions and represents a substantial operational cost. It’s a middle-ground game. In general, we work with about 5 to 10 segments.

segmentation rfm nommer segment

5. Operationalize segmentation in your marketing actions

Once companies have segmented and labeled each customer, they can personalize their messages. At-risk customers can be targeted with offers, discounts, or freebies, while loyal customers can benefit from a higher level of service to value them more.

To build an omnichannel customer relationship, recent customers can receive information about other products that may interest them. Top customers can also benefit from wider access to products and be used as a source of information before you launch these products with other customers. Of course, all of this can be done simultaneously.

Once the RFM analysis is complete, several actions can be put in place:

  • Prioritize your marketing budgets: A differentiated media strategy in different formats and media, for varying durations, can be created to target different segments according to their characteristics. You can thus choose to include or exclude specific segments of your target.
  • Personalize your messages: As a direct result of segmentation, you can now further personalize the messages you send to your customers. Personalized emails are a powerful way to increase your response rate from your prospects.
  • Identify and engage your champions: When launching a new product, the champion customer can be taken on board to spread the word. This promotion improves the perception of the product by other customers and encourages purchase.

Focus on Segment’s limitations and the best alternatives

While Segment is a powerful and relevant DMP and/or CDP solution, it is not the most appropriate for all business models.

The reason? Prices climb pretty quickly, especially for B2C players; the lack of an independent database and the rigidity of the data model limits your ability to strengthen your business intelligence.

Why are alternatives on the rise? The emergence of the modern data stack, through the crucial “single source of truth” role that your cloud data warehouse now plays, is an excellent opportunity to evolve towards a leaner, more flexible infrastructure, thanks to an independent database, and significantly less expensive for your customers’ data management.

Do you hesitate to choose Segment? Are you looking for alternatives? We have prepared a nice resource for you with a review of the alternatives to the main Segment modules: Connections, Personas, and Protocols.

Segment Alt resource

Access our comparison of the best alternatives to Segment

To directly access the comparison of the best alternatives to Segment, we invite you to click on the button above.

What is Segment?

From a web-tracking tool to a market-leading CDP

Founded in 2011, Segment was initially a web tracking tool in SaaS mode, allowing companies to track all the events that occur on the website, link them to a user ID, and store all weblogs in a data warehouse. With mid-market positioning (SME-ETI) and B2B, Segment was one of the first tools to democratize the extraction and storage of weblogs for BI purposes and customer experience personalization.

Slowly, Segment has broadened its functional spectrum. The platform has developed its integration capabilities with the company’s other data sources and tools. From a web-tracking tool, Segment has become a platform for managing CRM, marketing, sales, customer service data… In short, Segment has become a Customer Data Platform capable of connecting, unifying, and activating all customer data (essentially first-party) of the company.

Let’s go even further: Segment is one of the leading players in the CDP market. In 2020, Segment generated $144 million in revenue and was acquired by Twilio for a whopping $3.2 billion. The start-up has become a giant and has more than 20,000 clients, including IBM, GAP, Atlassian, and Time magazine.

segment alternatives
Source: Get Latka

Discovering the functional scope of Segment

Segment essentially allows for (1) connecting the different sources of customer data of the company, (2) building a unique customer vision and audience, and, finally, (3) monitoring the quality and integrity of data. These are the three main modules offered by the platform: Connections, Personas & Protocols.

#1 Connecting data [Connections]

“Connecting” a data source to a Customer Data Platform such as Segment involves generating events related to the behavior of visitors of the website or web application. Segment turns web behaviors into events and events into actionable data.

To set up connections, Segment offers a library of APIs but also, and this is its strength, a vast library of native connectors.

segment connections catalog
Segment offers an extensive library of native connectors (300+).

In addition to the impressive library of sources and destinations available, Segment handles very well:

  • The transformation of events. Some data types need to be transformed before being injected into other destination tools. The “Functions” module helps process basic event transformations before sending them to external applications with “only ten lines of JavaScript”. Segment also offers a no-code data transformation and enrichment feature only available as part of its Business offering.
  • Data synchronization in the data warehouse. Segment supports leading data warehouse solutions: Redshift, BigQuery, Postgres, Snowflake, or IBM DB2. However, the sync frequency is limited to 1 or 2 per day with the Free and Team plans. It can be much shorter, but you will have to upgrade to the Business plan, which is much more expensive.

Connecting to data sources is the most technical step in Segment. It requires the Tech/Data team’s involvement.

#2 The 360 ​​Customer View and Building Segments [Personas]

Once connected, data can be unified around a single customer ID. Segment offers a module (called “Personas”) that allows you to view all the data related to a particular customer and to access the famous “single customer view” or “360 customer view”. Customer data can then be used to build segments, i.e., lists of contacts sharing defined criteria (socio-demographic, behavioral, etc.). The audience segments can then be activated in the destination tools: MarTech and AdTech.

Segment’s “Personas” module is user-friendly, and usable by business teams with complete autonomy. Note that “Personas” is only accessible in the “Business” plan.

segment alternatives

Good to know

As with the vast majority of Segment’s advanced features, Personas is only available in the Business plan.

#3 Data Quality Management [Protocols]

The third key module of the Segment platform is called “Protocols” and is used to monitor data quality and integrity. It should be specified that there are many “Best of Breed” technological solutions offering advanced Data Quality functionalities. For example, in Metaplane or Telm.ai., Octolis, Data Quality functions are native, which means that you do not need to further invest in a third-party solution or module to manage the quality of your data.

Discover the alternatives to Segment

You now know the three main modules of Segment. For each of these modules, we offer you the best alternatives.

segment alternatives ressource notion

Access our comparison of the best alternatives to Segment

The main disadvantages of Segment

We have presented Segment, its history, and its features. Unquestionably, Segment is a good tool. It would be absurd to call this evidence into question, but Segment has several limitations to which we would like to draw your attention in this second part.

There are two main limitations: rapidly rising prices and a lack of data control.

Limitation #1 – Segment’s prices are increasing rapidly

Segment offers pricing based on the number of visitors tracked per month (MTU: monthly tracked users) on the different sources (website, mobile application, etc.). This pricing model is suitable for companies that generate significant revenue per user and have very active users (over 250 events per month). Beyond 250 events per month and per user on average, you must switch to the “Business” Segment plan with personalized prices (on quote).

If you plan to use Segment as your Customer Data Platform, you will quickly reach a budget of $100,000 per year, especially if you are a B2C company. In B2C, the number of events, segments, and properties is always higher than in B2B.

Segment has not been able to adapt its offer to suit the needs and constraints of companies wishing to use the platform to deploy CDP use cases.

alternatives segment pricing
The 3 formulas offered by Segment

Let’s take two examples:

  • You have a website that totals 100,000 unique visitors with three page views per month on average per visitor. The monthly subscription for 100,000 tracked visitors is around $1000 per month.
  • Let’s imagine that the site dedicated to your CRM generates around 8000 MTUs for an average of 200 events per MTU. In this case, Segment will cost you around $120 per month because you stay under the Team plan’s 10,000 MTU limit.

Limitation #2 – Segment does not give you complete control over your data

All logs are stored on Segment’s servers. You can send all the logs to your data warehouse if you have one, but you must pay a supplement. In our opinion, this is one of the main disadvantages of a solution like Segment.

Because of or thanks to the tightening of the law on personal data protection (RGPD in particular), first-party data has to be stored by the company in its data warehouse and not in the various software and SaaS services. This is the best way to keep complete control over your data.

The fact that the logs are stored in Segment also poses another problem: you are forced to comply with a data model that is not necessarily adapted to your company. Segment offers a data model limited to two objects: users and accounts, and in most cases, a user can belong to only one account.

In which cases can Segment remain a good choice?

Segment can remain a relevant choice despite the limits we just recalled in some instances. To simplify, we can say companies that meet the following criteria may find interest in choosing this platform:

  • You are a B2B company with few users/customers.
  • You have a small IT/Data team.
  • The volume of events is low or medium.
  • Money is not a problem for your business.
  • You want to deploy standard use cases.

From a certain level of maturity and development of your use cases, you will have more advanced needs in terms of tracking and aggregates. This means you will have to activate the “Personas” module that we presented to you above. Be aware that this additional module is charged extra… and is very expensive. At that point, you will be faced with an alternative: stay on Segment and be ready to pay 100k€ per year…or change architecture and opt for the implementation of a modern data stack.

Modern Data Stack offers more and more alternatives to Segment

Let’s repeat once again that Segment is undoubtedly a perfect tool; the problem is not there. Nonetheless, we believe it belongs to a family of tools (off-the-shelf CDPs) that is already outdated.

Off-the-shelf CDPs limits

Off-the-shelf Customer Data Platforms had their heyday in the late 2010s. For some time now, new approaches to collecting, unifying, and transforming customer data have emerged. We’ll walk you through the modern approach in a moment, but first, here are the main limitations of on-the-shelf Customer Data Platforms of which Segment is a part:

#1 CDPs are no longer the single source of truth

Increasingly, it’s the course of history as we have seen; data is stored and unified in cloud data warehouses like BigQuery, Snowflake, or Redshift. The data warehouse (DWH) centralizes ALL the data used for reporting and BI, unlike Customer Data Platforms which only contain data generated via connected sources: essentially customer data in the broad sense.

#2 CDPs tend to generate data silos

This happens for two main reasons. First, CDPs are built By Design for marketing teams. The publishers highlight this feature… except that it doesn’t offer only advantages. Why? Because it leads the marketing teams, on the one hand, and the data teams, on the other hand, to work each in their corner on different tools. We end up with two sources of truth:

  • The Customer Data Platform for the marketing team.
  • The data warehouse or data lake for the IT team.

A CDP empowers the marketing team from IT but promotes the compartmentalization of the two functions and their misalignment.

On the contrary, we are convinced that the marketing and IT/Data teams must work hand in hand.

#3 Standard CDPs have limited data preparation & transformation capabilities

Conventional Customer Data Platforms have limited data transformation capabilities. This problem echoes the data models’ issue. Data transformations are only possible within the framework of imposed data models.

The lack of data models’ flexibility offered (or imposed…) by the CDP leads to organizing the data in a way that does not always make sense from a business point of view.

#4 Lack of data control

We have already highlighted this problem. Storing all the data in your CDP poses privacy and security issues. It has become more and more essential to store data outside the software, in an autonomous database managed by the company itself. This brings us to the next point.

What is the purpose of data control?
Data control is not “nice to have”; it’s a must-have. Find out why it’s essential to stay in control of your data.

The Rise of Cloud Data Warehouses

A lot has changed in a decade in collecting, extracting, circulating, storing, preparing, transforming, redistributing, and activating data. The most significant development is that modern cloud data warehouses now play a central role. The DWH becomes the pivot of the information system, the center of the IT architecture around which all the other tools gravitate.

Amazon played a decisive role in this revolution with the launch of Redshift in 2012. The game was changed by the collapse of storage costs and the exponential increase in the computing power of machines. This has led to a democratization of data warehouses. Today, a small business with limited needs can use Redshift for a few hundred dollars a month. For information, the classic data warehouse annual license, “On-Premise”, easily reaches 100k€…

stack data moderne
Typical diagram of a modern data stack, with the cloud data warehouse as the pivot.

Cloud data warehouses have become the new standard for most organizations. They are used to store all data, including customer data, but not only. All company data can be centralized and organized there.

Understanding the role of Reverse ETL

Cloud data warehouse solutions have experienced significant growth since 2012. Gafams have almost all entered this market: Google has developed BigQuery, Microsoft has launched Azure, etc. We have also seen the emergence of pure players like Snowflake, which is experiencing spectacular growth.

alternatives segment snowflake stats
Source: Get Latka

But there was a lack of a functional brick allowing warehouse data to be synchronized in the activation software so that it would not only be used for reporting. A new family of tools appeared at the end of the 2010s to fulfill this function: Reverse ETLs.

A Reverse ETL synchronizes the data from the DWH in the operational tools: Ads, CRM, support, Marketing Automation… Therefore, it does the opposite of an ETL which is used to send data back to the data warehouse. Hence the name “Reverse ETL”. With a Reverse ETL:

  • You control your data because it remains in your data warehouse: the Reverse ETL is a synchronization tool. Your data never leaves the DWH.
  • You can create custom data models, far from being limited to the two objects offered by Segment (users and accounts).

Modern data warehouses and Reverse ETLs draw a new architecture: the modern data stack. With these two technologies combined, your data warehouse becomes your CDP. This architecture makes it possible to implement the “Operational Analytics” approach which, in a nutshell, consists of putting data at the service of business operations and no longer solely at the service of analytics.

Discovering Modern Data Stack

Modern data stack is the architecture of making the data warehouse the sole source of truth for the IS and using a Reverse ETL to activate DWH data in operational software. Check out our complete guide to Modern Data Stack.

Access our comparison of the best alternatives to Segment

Pour accéder à la ressource, il vous suffit de cliquer sur le bouton ci-dessous
Une fois dans notre espace dédiée, vous découvrirez d'autres ressources structurantes, les plus complètes nécessitent une inscription rapide mais sont toutes gratuites ! Avec un peu de chance, vous aurez une bonne surprise, il y aura d'autres ressources qui vous seront utiles 😊

👉 J'accède directement à la ressource

Why is it important to keep control of customer data?

Are you sure you have control over your customer data? If you’re reading these lines, a doubt probably assails you. And you’re right to doubt it because you may not be in control of your data.

Suppose your customers’ data are stored in your software (CRM, CDP, Marketing Automation). In that case, you don’t have full access to data, and you’re not free to manage security and confidentiality rules finely. You’re a prisoner of data models proposed (imposed) by editors. You’re locked into their ecosystem. 

Rest assured, you’re not alone in this case. Most organizations agree to store their data in their SaaS applications.

It’s time for things to change and for you to take back control of your customer data.

How to do it? This is the subject of this article.

The 3 key dimensions of data control

What does it actually mean to have control over your data? Having control over your data means:

  1. Full access to your data.
  2. Ability to manage data security (rights & permissions).
  3. Data privacy management.

Let’s go back in detail on each of these points, based on examples of tools: Google Analytics, Snowflake, and Amazon S3.

CritèresGoogle AnalyticsSnowflakeAWS S3Data center 'in-house'
Accessibilité des données🔒🔒🔒🔒🔒🔒🔒🔒🔒
Sécurité des données🔒🔒🔒🔒🔒🔒🔒🔒
Contrôle de la confidentialité🔒🔒🔒🔒🔒🔒🔒🔒

#1 Data accessibility (Level of data openness)

The first dimension of data control is the level of access to your data. It changes according to the tools and systems used. If we take examples like Google Analytics, Snowflake, and AWS 3, there’s one thing in common. In all three cases, the data are hosted in the cloud, but the level of data accessibility is not identical at all.

Data stored in Google Analytics are only accessible through dashboards and reports that Google gives you access. There’s no way to access the underlying data used to build the dashboards. You cannot make an SQL query on the Google Analytics database. So clearly, the level of access to data on Google Analytics is very low. You don’t have control of your data!

In a cloud infrastructure like Snowflake, you can interact with your data through complex SQL queries, taking advantage of all the computing power offered by a modern DWH Cloud. However, you cannot run Spark jobs.

This would be technically possible but very expensive in practice. On the other hand, it is feasible with Amazon S3, which, therefore, is the solution that offers the best level of access to data. Not only can you connect S3 to your BI tools and run SQL queries, but you can extract data and load it into Spark or your other applications.

The data access issue also encompasses data portability, i.e., the ability to extract data from one tool and host it in another database and tool. 

In terms of portability, Amazon S3 wins the prize. For example, you can easily switch your data from Amazon S3 to Google Cloud. Conversely, you cannot extract data from Google Analytics to other systems in its raw state.

#2 Data security (management and control of access & permissions)

The second dimension of data control is security. The level of data security is measured by your ability to manage access to your data. If you manage everything, then the level of data security is at the top. If you choose a cloud solution, be it Google Analytics and cloud infrastructure like Amazon S3, you don’t have complete control over data security. You’re limited by the access & rights management features offered by the solution.

On Google Analytics, you can manage user-based access, but you cannot set up attribute-based access control, as is the case with Amazon S3. If you store your data on your machines, you can create 100% tailor-made rights and permissions management mechanisms. 

The level of control over data security will always be lower with a SaaS/Cloud solution than with a self-hosted solution. The more sensitive the data you store, the more important it is to be well informed about the policies applied by cloud publishers.

Security management needs are not the same for all companies. A company with a small customer base and collects little data about its customers will typically have less trouble hosting its data in a cloud infrastructure like Snowflake or Amazon S3 than a big bank that stores large volumes of highly sensitive data.

#3 Privacy management

Privacy management is the third dimension of data control.

Data security, which we talked about above, is about who has access to your data. Data confidentiality is about the use of the data and whether it’s legal and approved by the user.

Let’s take our 3 examples to illustrate this dimension: Google Analytics, Snowflake, and Amazon S3. In these three companies, certain employees have access to your raw data. What they do or can do with your data, however, isn’t the same:

  • Google Analytics. There are Google employees with access to the reports you configured in Analytics. Google likely uses “your” Google Analytics data to create a user profile for marketing purposes. Even if what Google does with your visitor/customer data is unclear, there is no doubt that they use it.
  • Snowflake and AWS3. It appears likely that employees within these companies have more or less limited access to your raw data, but their analytical capabilities are more limited. They should be able to do reverse engineering to use your data. They can’t link customer data together and create a user profile as Google can. In addition, note that, in S3, you can encrypt your data.

When it comes to privacy, the focus is clearly on cloud infrastructure solutions like Snowflake or AWS 3.

Lack of data control = risk

The coupling data <> applications, a legacy of CRM/CDP publishers

Customer data is used by CRM solutions, Marketing Automation software, and other Customer Data Platforms. They are the fuel. What characterizes these programs is the coupling data <> applications. Clearly, your data is stored in applications, in your software. There’s no separation between the data layer and the software layer.

That’s how CRM and CDP editors traditionally operate. Data is collected, stored, and activated by and within the software. The CRM, or the CDP, is both a database (with restricted access to data) and an activation tool. 

The development of the SaaS model in CRM has not changed much in this situation: coupling remains the rule. Traditional or SaaS, same fight. The same goes for the Customer Data Platforms discussed so much for a few years.

Salesforce’s “anti-software” campaign was in its infancy, before becoming the symbol of these closed ecosystems

Why is storing customer data in software (CRM, CDP, etc.) problematic?

Customer data stored in applications is problematic for several reasons rarely mentioned by publishers, integrators, and other ESNs (Enterprise Social Networks) who take advantage of the prison implied by this coupling.

guantanomo numérique

The “Digital Guantanamo”, evoked by Louis Naugès, where ESN play the role of guardians of the imprisoned CIOs.

Customer data is your most valuable asset. However, CRM, CDP, and Marketing Automation publishers only give you restricted access to this data. You’re a prisoner of the data models imposed by the software; you can’t access your data in their raw state and organize them in the data model of your choice. You are limited by the infrastructure choices of the solution vendor.

The business consequences are more serious than they appear. Lacking flexibility of data models reduces the ability of your marketing teams to adapt the scores and processing rules to your business specifics. Less targeted campaigns or less personalization can be fatal in the race for the ultimate omnichannel customer relationship led by brands today.

The other direct consequence of this low flexibility is that your teams lack progress and maturity in exploiting customer data. Your business teams will not learn to imagine use cases outside the framework offered by your CRM or CDP, and you will miss opportunities within your customer journey.

Discover business use cases

To help you imagine what you can do with full control over your data, we have put together a library of concrete use cases, don’t hesitate to consult it.

On the other hand, access to your customer database, organized and stored in your CRM/CDP, is chargeable. You must pay access fees to view and use your data! As everyone knows, the economic model of classic solutions for activating customer data (CRM, Marketing Automation, ERP, CDP) is based on pricing by several users. Even a user who only needs access to the database on a very occasional basis will have to pay a subscription.

In fact, you are locked into a specific ecosystem, built by the publisher, that cuts you off from outside. It can be vast: think of CRMs that offer dozens of different modules. But it is still a rigid framework.

The BlackBerry example

To illustrate, let’s take the example of BlackBerry. We owe this example to David Bessis, who describes it in a beautiful Medium article dedicated to the rise of open data technologies. Broadly, BlackBerry was the king of the world from 2001 to 2008. And then came the iPhone, in 2007. And then a bit later, Android. And boom, BlackBerry collapsed.

Between 2008 and 2012, BlackBerry’s market share was divided by 20. There are several reasons for this, but the main one is this: BlackBerry was built like a black box. Nobody could create BlackBerry applications; BlackBerry had a stronghold on writing the code…unlike iOS and Android, which immediately positioned themselves as open platforms.

Like BlackBerry, CRM / CDP publishers are closed platforms that hinder the development and enrichment of your data use cases. Think about it, how freer you would be if you could have your data in a database, independent of your CRM/CDP, to use it in other tools for other purposes!

A solution, even if it’s a suite of software, cannot do everything. Locking yourself into a publisher’s ecosystem inevitably means missing out on specific uses of customer data.

How does modern stack data allow you to regain control of your data?

We showed a problem: the coupling of data with applications. The consequence is lacking control of your customer data. Let’s now talk about the solution: Modern Stack Data. 

The term is barbaric, jargon, we grant you, but it designates a simple reality. It is a new way of organizing data, a tripartite organization:

  1. A Cloud Datawarehouse which serves as the company’s database. It is the main enterprise database that helps unify structured and semi-structured data.
  2. Business tools that exploit data for analysis and manly activation purposes. BI tools such as Tableau or PowerBI and, above all, tools such as CRM, Marketing Automation, Google/Facebook Ads, Diabolocom, etc.
  3. An ETL and/or a Reverse ETL allows data to circulate between the Datawarehouse and the other company systems: the software.

The modern Data warehouse as an operational base

Note that we are not talking here about the new generation Data warehouses, which have been booming since the beginning of the 2010s: cloud Data warehouses. We think of names like BigQuery (Google), Snowflake, Redshift (Amazon), or Azure (Microsoft) that have become democratized and are now accessible to SMEs and startups.

So, what are we talking about? 

A modern Data warehouse is a cloud database used to store all of the company’s structured or semi-structured data. More than just a warehouse, a Data warehouse is a war machine that allows you to execute SQL queries and perform operations on huge volumes of data…all much faster than transactional databases ( OLTP).

We are convinced today:

  • That the data must be stored in a separate database from the software.
  • That the Cloud Data warehouse is by far the most powerful and economical solution to act as a master database.

With this in mind, the Data warehouse is intended to become the keystone, the pivotal solution of the modern company’s information system. 

In this article on the Modern Stack Data, we go more into detail about our convictions regarding Data warehouse-type cloud infrastructures and the main advantages of these solutions. Also, discover our article “Why you should use your Data Warehouse to play the role of Customer Data Platform.”

ETL & Reverse ETL

We can represent Modern Stack Data in this way:

octolis

ETL and Reverse ETL are the tools that allow data to circulate better in the information system and tools while maintaining control. More specifically:

  • ETL (Extract – Transform – Load) is the technology that connects to data sources, transforms them, and loads them into the Datawarehouse cloud. Two examples of ETL? Stitch Data & Fivetran.
  • The Reverse ETL is a more recent family of solutions that allows data to be redistributed from the Data Warehouse to business tools (CRM, Marketing Automation, e-commerce, etc.), in the form of segments, aggregates, and scorings. It is the centerpiece that allows business teams to access data from the data warehouse. An example of Reverse ETL? Octolis!

customer data stack

It is this modern data architecture, linking Data Warehouse Cloud and ETL/Reverse ETL, which ensures the highest level of data control:

  • Data are kept in a software-independent database. They are stored neither in your business applications, ETL, nor your Reverse ETL, but your data warehouse.
  • You can create custom data models to meet your specific needs and use cases.
  • The calculation performance of your database is much better than that offered by CRM/CDP editors.
  • You centrally and granularly control access and permissions to the database (the DWH).

Conclusion

Companies need to be aware of the risks and costs of storing customer data in software, no matter how powerful CDPs are. Today, it is possible and desirable to regain control over your customer data. 

We have seen that this requires a new organization of your data called the “modern data stack”: your customer data is hosted and consolidated in a Data Warehouse and redistributed to your software via a “Reverse ETL” like Octolis.

Data sovereignty is a necessary (although not sufficient) condition for deploying innovative, and ROIst data use cases. Taking back control of your customer data is the first step to becoming truly data-driven.

Definition and analysis of Modern Stack Data

A Data Engineer cryopreserved in 2010 and woken up by mischief today would no longer understand much about modern stack data.

Remember, in only a few years, the way of collecting, extracting, transporting, storing, preparing, transforming, redistributing, and activating data has completely changed.

We changed the world, and opportunities to generate business through data have never been greater.

What does the modern data stack look like?

We can start with a macro diagram.

stack data moderne

The most striking development is the centralized place occupied (gradually) by the Cloud Data Warehouse, which has become the pivotal system of the IT infrastructure. From this flow all other notable transformations:

  • The exponential increase in computing power and storage costs’ collapse.
  • The replacement of traditional ETL tools by EL(T) Cloud solutions.
  • “Self-service” Cloud BI solutions development.
  • The Reverse ETLs’ recent emergence that allows data from the Cloud Data Warehouse to be sent down into business tools, as to finally put the stack data at the service of the marketing stack.
stack data moderne dnowpl
Source: Snowplow Analytics.

Let’s get to the heart of the matter.

We’ll introduce you to the modern data stack outlines; we chose two angles:

  • The historical angle: What led to the emergence of modern data stack?
  • The geographic/topographic angle: We’ll review the different bricks that make up this modern data stack.

🌱 The changes behind the modern data stack

Modern data stack defines the set of tools and databases used to manage the data that feed business applications.

The Stack data’s architecture has undergone profound transformations in recent years, marked by:

  • The rise of Cloud Data Warehouses (DWH) which are gradually becoming the main source of data. The DWH is destined to become the pivot of the data stack, and we’ll have the opportunity to talk about it at length in our blog posts. If you still believe in the on-the-shelf Customer Data Platform, abandon all hope.
  • Switching from ETL (Extract-Transform-Load) to EL(T): Extract – Load – (Transform). “ETL” is a concept, process, as well as a term tool (ETL software). In a modern data stack, data is loaded into the master database before being transformed via EL(T) solutions in the cloud, which are lighter than traditional ETL tools.
  • The growing use of self-service analytics solutions (like Tableau) to do BI, generate reports, and other data visualizations.

The rise of the Cloud DataWarehouses (DWH)

Data Warehouse technology is as old as the world, or almost. In any case, it’s not a new word. And yet, we’ve seen a dramatic transformation of the Data Warehousing landscape over the past decade.

Traditional DWH solutions gradually give way to cloud solutions: the Cloud Data Warehouse. We can precisely date this evolution: October 2012, the date of marketing Amazon’s Cloud DWH solution: Redshift. There’s a clear before and an after, even if Redshift is losing ground today.

The main impetus that birthed the modern data stack came from Amazon, with Redshift. All the other solutions on the market that followed owe a debt to the American giant: Google BigQuery, Snowflake, and a few others. This development is linked to the difference between MPP (Massively parallel processing) or OLAP systems like Redshift and OLTP systems like PostgreSQL. But this discussion deserves a whole article that we’ll probably produce one day.

In short, Redshift can process SQL queries and perform joins on huge data volumes 10 to 10,000 times faster than OLTP databases.

But note that Redshift is not the first MPP database. The first ones appeared a decade earlier, but on the other hand, Redshift is:

  • The first cloud-based MPP database solution.
  • The first BDD MPP solution that’s financially accessible to all companies. A small business with limited needs can use Redshift for a few hundred euros per month while you have to count close to 100k€ of annual license with the classic On-Premise solutions.

In recent years, BigQuery and especially Snowflake have risen in power. These two solutions now have the best offers on the market, both in terms of price and computing power. Special mention for Snowflake, which offers a very interesting pricing model since storage billing is independent of computing billing.

But because we have to give back to Caesar his due – Caesar being Redshift here, let’s remember these few figures:

  • RedShift was launched in 2012.
  • BigQuery, Google’s Cloud DWH solution, only integrated the SQL standard in 2016.
  • Snowflake only became mature in 2017-2018.

What changes with Cloud Data Warehouse?

The advent of Redshift and other Cloud Data Warehouse solutions that followed have made it possible to improve on several levels:

  • Speed. This is what we have just seen. A Cloud DWH can significantly reduce the processing time of SQL queries. The slowness of calculations was the main obstacle to the massive exploitation of data. Redshift broke many barriers.
  • Connectivity. The Cloud makes it much easier to connect data sources to the Data Warehouse. More generally, a Cloud DWH manages far more formats & data sources than a traditional data warehouse installed on company servers (On-Premise).
  • User access. In a classic, “heavy” Data Warehouse installed on the company’s servers, the number of users is deliberately limited to reduce the number of requests and save server resources. This classic technological option, therefore, has repercussions at the organizational level:
    • DWH On-Premise: Managed by a central team. Restricted/indirect access for end-users.
    • Cloud DWH: Accessible and usable by all target users. Virtual servers allow the launching of simultaneous SQL queries on the same database.
  • Flexibility & Scalability. Cloud Data Warehouse solutions are much more affordable than traditional On-Premise solutions (such as Informatica or Oracle). They are also and above all far more flexible, with pricing models based on the volume of data stored and/or the computing resources consumed. In this sense, the advent of Cloud Data Warehouses has made it possible to democratize access to this type of solution. While classic DWHs were cumbersome solutions accessible only to large companies, Cloud DWHs are lightweight, flexible solutions accessible to a very small business/startup.

The transition from ETL solutions to EL(T)

Extract-Transform-Load = ETL while Extract-Load-(Transform) = EL(T).

Listing these acronyms makes the difference quite easy to understand:

  • When using an ETL process (and the ETL tools that allow this process to operate), the data is transformed before loading into the target database: the Data Warehouse.
  • When you use an EL(T) process, you start by loading all the structured or semi-structured data into the master database (DWH) before considering the transformations.

What are the underlying issues of such an inversion? It’s quite simple.

Transformations consist of:

  • adapting the format of data to the target database,
  • cleaning,
  • deduplicating,
  • carrying out some treatments on data from the sources to adapt them to the design of the Data Warehouse and avoid cluttering it too much.

That is the challenge.

Transforming before Loading helps to evacuate part of the data and therefore, avoids overloading the master database too much.

Indeed, that is why all traditional Data Warehouse solutions worked with heavy ETL solutions. It was vital to sort before loading into the DWH with limited storage capacities.

With Cloud Data Warehouses, storage cost has become a commodity, and computing power has increased dramatically.

Result: No need to transform before loading.

The DWH On-Premise – ETL On-Premise combination gradually gives way to the modern Cloud DWH – EL(T) Cloud combination.

Loading data into the Data Warehouse before any transformations avoids asking strategic and business questions when extracting and integrating data into the DWH.

Pipeline management’s cost is considerably reduced; we can afford to load everything into the DWH “without getting carried away” – and thus, we do not deprive ourselves of future use cases for the data.

The trend toward self-service Analytics

We have talked about the Cloud Data Warehouse, which is becoming the backbone of the modern data stack. Upstream, we have the EL(T) tools that connect the multiple data systems and the data warehouse. Data Warehouse Cloud data is then used for BI, data analysis, dashboarding, and reporting.

The advent of Cloud DWH has contributed to “cloudify” not only integration solutions (ETL/ELT) but also BI solutions.

Today, we have dozens of cloud-based BI solutions vendors on the market that are affordable and designed for business users. These easy-to-use solutions offer native connectors with the main Cloud Data Warehouses on the market.

Power BI, Looker, or Tableau are reference Cloud BI solutions:

Source: Medium.
  • A solution like Tableau allows you to connect all data sources in a few clicks and create tailor-made reports based on simplified data models.
  • A BI solution allows overall performance management based on omnichannel attribution models, unlike reporting modules offered by business applications or web analytics solutions (Google Analytics, etc.).
  • A tool like Looker, connected to the Data Warehouse, disrupts data analysis. BI is one of the main use cases of a Data Warehouse. With Cloud DWH’s advent, the development of BI SaaS solutions was inevitable. And it happened.
  • Cloud Data Warehouse, EL(T), “self-service” analytics solutions: closely linked, these three families of tools are the cornerstones of a modern data stack.

🔎 Zoom on modern data stack’s bricks

We will now review the main bricks that make up the modern data stack in more detail, starting from the diagram presented in the introduction.

Typical diagram of a modern data stack

We appreciate this modern data stack diagram proposed by a16z.

stack data moderne mapping
Source: a16z.

From left to right, we find:

  • The data source – all systems, bases, and tools providing data that can be internal or external (enrichment solutions, etc.). Linked to the development of digital, we see the explosion not only of data volumes but also of data sources – and therefore of formats and data structures. This effervescence is both an enormous potential and a great challenge.
  • Data ingestion and/or transformation solutions. Here we find all technologies for carrying out the process Extract – Load and possibly Transform: EL(T), which means the solutions that allow the routing (with or without transformations) of data coming from the sources in the master database(s).
  • The master database(s) for storing data. There are two families of solutions here: Cloud Data Warehouses and Data Lakes. The DWH stores structured or semi-structured data, while the Data Lake can store any data type.

The Data Lake is a bathtub in which all data is poured in bulk without any transformations or processing, in its raw state. This Data Scientists’ tool serves for very advanced data use cases such as Machine Learning.

The Data Warehouse remains a “warehouse” organizing data in a structured way, even if its capacities to integrate semi-structured data are clearly increasing. These capabilities’ development elsewhere makes DWH increasingly pivotal – unlike the “pure” Data Lake, which increasingly plays a secondary role. We shall return to it.

  • Data preparation and processing tools. We have seen the Cloud Data Warehouse tends to become the reference tool for transforming data via SQL. Many solutions can support the DWH in this data transformation process for BI or business uses. Preparation and transformation tools design the widest and most heterogeneous family of data solutions.
  • BI Tools and Enabling Tools, which are Cloud Data Warehouse data destination tools. The DWH, basically used for BI, is increasingly used to feed business applications in near real-time. This is where Reverse ETLs like Octolis come in. We will introduce you to Reverse ETLs’ role in modern data stack in a few moments.

Let’s now review each of these bricks of the modern data stack.

The Cloud Data Warehouse

The Cloud DWH is the foundation of the modern data stack, the pivotal solution around which all other tools revolve.

It stores structured and semi-structured enterprise data and is not just a database. It’s also a data laboratory, a veritable machine. It is a place of data preparation and transformation via one main tool: SQL, even if Python is increasingly used (but that is another subject).

Légende : Medium. Mai 2020. Redshift plafonne, BigQuery monte, Snowflake explose.

The Cloud Data Warehouse is sometimes built downstream of a Data Lake which serves, as a catch-all, a tub of data stored in its raw state.

We can well use both Data Lake and Cloud Data Warehouse. You don’t necessarily have to choose between the two technologies. To be honest, they fulfill different roles and can be complementary…even if it’s a safe bet that the two technologies are called to merge.

Also, note that some actors, such as Snowflake, offer integrated Cloud Data Warehouse and Data Lake solutions. It’s a possible article’s title: Are Data Lake and Cloud Data Warehouse destined to merge? Though it’s not the subject of this article, it is a debate that stirs many expert heads!

However, the entire modern data stack is organized around the Cloud Data Warehouse, connected or merged with the Data Lake.

EL(T) solutions

As seen in the first section of the article, EL(T) solutions prevail over traditional ETL tools. This evolution reflects a transformation in the data integration process, a significant evolution in building the data pipeline.

Source: AWS. ETL Vs ELT.

A question you may have asked yourself: Why put “T” into parentheses?

For a simple and good reason, the tool used to build the data pipeline between the source systems and the Cloud Data Warehouse no longer needs to transform the data.

EL(T) Cloud solutions (Portable, Fivetran, Stitch Data, etc.) are primarily used to organize piping. This is their main role. It is now Cloud Data Warehouse solutions and third-party tools that support the transformation phases.

A Cloud DWH solution helps transform data tables with a few lines of SQL.

We’ll have to talk about this evolution again: Most Data Preparation and Data Transformation operations can now be performed in the Cloud Data Warehouse itself, using SQL.

Data Engineers (in Java, Python, and other Scala) are increasingly leaving Data transformations to Data Analysts and business teams using SQL. This also raises a real question: What role for the Data Engineer tomorrow? Its role in the organization and maintenance of modern data stack is not assured.

The goal of a modern data stack is to empower the end-users of the data. It’s increasingly at the service of the business teams and the marketing stack they handle.

The modern data stack breaks down barriers between data and marketing; it is the sine qua non of efficient Data-Marketing, the condition for becoming truly “data-driven.”

Preparation/transformation solutions

In a modern data stack, data preparation, and transformation take place:

  • Either in the Cloud Data Warehouse itself, as we have seen.
  • Or downstream of the Cloud Data Warehouse, via ETL tools.

Or the most frequent case, by the DWH, reinforced by third-party tools.

Data preparation or transformation is the art of making data usable. This phase consists of answering a simple question: How to transform raw data into a data set that the business can use?

An example of a raw data preparation solution: Dataform.

Data transformation is a multifaceted process involving different processing types:

  • data cleaning,
  • deduplication,
  • setting up tailor-made data update rules,
  • data enrichment,
  • creation of aggregates,
  • dynamic segments, etc.

Preparation and transformation tools are also used to maintain Data Quality. Because data “transformation” refers to operations of a different nature, it’s not surprising that the modern data stack hosts several tools belonging to this large multifaceted family.

Data management solutions (Data governance)

Cloud Data Warehouse’s accessibility and usability by a large number of users is, of course, a positive thing. The potential problem is the chaos these expanded accesses can cause in terms of Data Management.

To avoid falling into this trap, the company must absolutely:

  • Integrate one or more Data Management tools into the data stack
  • Document and implement data governance rules.

Issues around Data Governance are more topical than ever

The first reason we have just mentioned is open access to and editing data stack solutions.

The second reason is the explosion of data volumes which requires the implementation of strict governance rules.

The third reason is the strengthening of the rules governing the use of personal data. The famous GDPR in particular…
Data governance is a sensitive subject that organizations generally deal with inadequately. It’s not the sexiest subject, but it clearly needs to be integrated into the roadmap.

Reverse ETL solutions

Let’s end with a whole new family of data solutions, much sexier and with a promising future: the Reverse ETL. We will soon publish a complete article on the Reverse ETL, its role, and its place in the modern data stack. Let’s summarize here in a few words the issues and functionalities offered by these new kinds of solutions.

The challenge is straightforward: Data from various and varied data sources goes up in the Cloud Data Warehouse but still has a lot of trouble going back down into the management activation tools: CRM, Marketing Automation, ticketing solutions, e-commerce, etc.

Reverse ETL is the solution that organizes and facilitates the transfer of DWH data into the tools used by operational teams.
With a Reverse ETL, data from the Cloud Data Warehouse is no longer just used to feed the BI solution; it is also used to benefit the business teams in their daily tools.

This is why we speak of “Reverse ETL”.

Where the ETL (or ELT) moves the data up in the DWH, the Reverse ETL does the opposite. It pushes the data down from the DWH into the tools.

The Reverse ETL is the solution that connects the data stack and the marketing stack in a broad sense. It’s at the interface of the two.

An example? With a Reverse ETL, you can feed web activity data (stored in the DWH) into the CRM software to help sales reps improve their prospect/customer relationship. But it is one use case among many others… The multiple cases are likely to increase in the coming months and years.

Census, HighTouch, and of course Octolis are three examples of Reverse ETL.

🏁 Conclusion

Infrastructures, technologies, practices, and even Data marketing professions have evolved at an incredible speed in the broadest sense. We’ve seen the central place this modern data stack gives to the Cloud Data Warehouse. Everything revolves around this point of gravity.

Certain recent developments and particularly including the fashion for on-the-shelf Customer Data Platforms, somewhat distort the understanding of what’s really going on.

But make no mistake, the arrow of the future is clearly pointing toward Data Warehouses (which no longer have anything to do with their On-Premise ancestors).

Towards the Cloud DWH side…and the whole ecosystem of tools revolving around it: EL(T), BI Cloud solutions…and of course Reverse ETL.

Towards a paradigm shift in the Customer Data Platforms market

Customer Data Platforms or CDPs are very popular these days. The term “CDP” designates different things: “pure player” solutions, CRM, and Marketing tools that have skilfully taken up the term.

There’s probably a trend around the expression “CDP,” but this surface agitation hides a real underlying movement. More than ever, businesses should better leverage customer data to improve marketing and sales performance.

Off-the-shelf CDP solutions aren’t the only approaches to address this need. Many companies choose to personalize their customer database.

Contrary to what one might think, the big winners of this fundamental movement will not necessarily be CDP software publishers or CRM solutions but rather the major Cloud platforms.

🚀 The Rise of Customer Data Platforms

A Customer Data Platform is an off-the-shelf solution created to organize, unify and transform customer data.

Publishers always put forward the same promises:

  • The CDP manages all data, online and offline, including behavioral data, unlike traditional CRMs.
  • Thanks to many connectors that make CDP editors proud, it can connect to all data sources and activation tools.
  • It is easy to use and gives power back to marketing teams and, more generally, business users.

This is enough to justify the enthusiasm around this technology.

3 indices of CDP success

CDP is undeniably popular. Several indices prove this:

  • The volume of searches in Google for the expressions “CDP” and “Customer Data Platform.” Google Trends chart is very clear.
customer data platforms market trends
Source : Google Trends
  • The increasing number of software companies using the term CDP. Do you offer a customer data management marketing solution? Call it “CDP,” it sells better!
  • All consulting firms will tell you the number of CDP projects is increasing.

A simple fashion effect?

Sure, there is a fad, but as we said initially, it’s about the expression “CDP.” The drivers of this trend are very solid. The primary reason for CDP’s popularity is its capacity to respond to problems that are only growing:

  • Pressure from the market, from customers, to set up an ultra-personalized customer relationship on every canal. All companies want to offer an omnichannel customer experience, but the good old CRM can’t do it.
  • Data sources proliferation and the resulting increase in data dispersion.
  • Marketing teams are willing to gain autonomy to use data in their operational tools: emailing, retargeting, chatbot, etc. Marketing is fed up with the Data Lake.
  • The accessibility of AI / Data technologies to exploit behavioral data.

CDP’s promises recalled above seem to respond to all these problems and needs directly. Logically, CDP appears as the ideal solution, and its popularity increases.

📚 Many possible approaches to building a CDP

Several approaches are possible to build a CDP.

The first is to buy a CDP off the shelf. In this case, you will make your choice in a market of two types of actors: big ones and small ones, behemoths of CRM and pure players.

The other option is to build your custom CDP: the Build approach (vs. the Buy approach).

Big CRM publishers have invaded the CDP market

Almost all CRM giants have launched their CDP offers; it’s a reliable sign. Salesforce, Microsoft, Adobe, SAP, all these behemoths have followed the movement, surfing on the craze for the expression CDP.

These players develop “CDPs” as software bricks attached to the publisher’s CRM ecosystem rather than open platforms. Salesforce CDP, for example, is a brick of Marketing Cloud.

salesforce cdp

Salesforce’s offer sums up all CDP promises:

  • Data unification around a unique customer identifier to obtain the famous single customer vision.
  • Creation of audience segments from unified data to set up ultra-targeted actions and campaigns.
  • Data activation in marketing and sales tools.

The Salesforce CDP landing page is a breviary of CDP promises.

The rise of CDP pure players since 2015

Alongside these dominant players gravitates a whole galaxy of “pure players,” former DMPs or tag managers who have converted to CDPs.

customer data platform market
Source : Chiefmartec.

Source: Chiefmartec

One of the latest reports from the CDP Institute gives interesting information on the CDP market and its evolution, including:

  • The CDP market is made of a large number of publishers. The CDP Institute lists 151 in its July report.
  • The market is divided into two groups of players:
    • The big mature players, who existed before 2013. Thanks to resounding fundraising and takeovers, these leaders are getting stronger.
    • Small CDPs created after 2014 (when the expression CDP emerged). Many of them have been redeemed.

So, we’re witnessing a movement of concentration; big ones redeem little ones. Leaders drive market dynamics.

cdp market growth
Source : CDP Institute

Build vs. Buy

The “big” vs. “small” distinction should not hide the real structuring distinction: Buy vs. Build.

There are two ways to obtain a Customer Data Platform:

  • Buy a solution on the market, off the shelf solution > Buy
  • Build a tailor-made CDP designed for the company’s specific needs > Build.

The CDP craze has tended to overshadow the second approach. We finally associated the term “CDP” with off-the-shelf solutions.

But things are changing, and tailor-made approaches have become more popular. We’ll soon see why.

How do you choose between these two technological options?

Let’s recall the strengths and weaknesses of each option on the main selection criteria:

  • Cost. When it comes to deployment cost, the off-the-shelf CDP option is the most attractive because building a custom CDP requires more work than buying a license and installing pre-configured software. But, the operating costs of a tailor-made CDP are lower. Off-the-shelf CDP licenses are costly.
  • Customization. Building a CDP is the best way to have a platform that perfectly meets the company’s target use cases. On the other hand, “ready to wear” CDPs impose their data models and don’t always allow you to deploy all target use cases.
  • Data security. When you choose the off-the-shelf CDP option, your data is hosted on the publisher’s servers. But with your own CDP, you host on your servers (on-premises) or in the cloud on rented servers. So you have better control over your data.
  • The complexity. A Customer Data Platform is powered by many data sources, each with its own language and data model. Succeeding in unifying this data in a tailor-made database is a challenge. As always, Tailor-made always travels with its sister, “Complexity.” If you aim for simplicity, choosing a tailor-made CDP is very tempting.
  • The deployment time. Installing and configuring an off-the-shelf CDP is faster than creating one from scratch. It takes one month of deployment in the first case and between 2 and 4 months in the second.

Each of the two options (Buy or Build) has advantages and disadvantages. So, making a choice is not easy.

But do we really have to choose between these two options?

Why not combine the best of both worlds?

We’ll present a third approach; hybrid and Data Warehouse first.

The hybrid approach, Data Warehouse first, is soaring

History direction increasingly favors the hybrid approach that involves building the CDP into your Cloud Data Warehouse. Therefore, you can benefit from all the functionalities offered by a modern CDP: many possible integrations, the identity resolution essential to building a Single Repository, etc., while keeping control over the data.

This approach deserves attention.

Why?

For at least 3 reasons. It’s:

  • The most profitable. You don’t have to pay a CDP publisher to host your data on its servers. CDP publishers’ data storage charges far exceed those of a Cloud Data Warehouse publisher. By using DWH, storing your data becomes convenient.
  • The most secure. The data is not controlled by the CDP editor, only by you.
  • The most flexible. Connectivity is a strong point of Data Warehouse Cloud solutions. Each DWH platform offers hundreds of connectors with leading MarTech data sources and tools. But native connectors offered by the CDPs don’t limit you. DWHs offer more flexible and broader integration solutions.

🏆 A paradigm shift that will benefit (big) cloud platform publishers more than SaaS publishers

The hybrid approach leads to a paradigm shift. Its main characteristic is the central place of the Data Warehouse Cloud. Actors offering DWH Cloud solutions certainly have a bright future ahead of them. The time when the MarTech market was dominated by an oligopoly made up of Salesforce, Oracle, SAP, and Adobe is almost over.

What if the main MarTech actors became BigQuery (Google), Redshift (Amazon), Azure (Microsoft), or even Snowflake Obviously, they have everything to gain from the development of DWH-first approaches.

Off-the-shelf CDPs are ETLs with a software layer

In the past (but this past is still actual for many organizations), companies used applications that each worked with its database, whether developed by the same or different publishers.

For example, suppose you use Salesforce Marketing Cloud (for marketing), Salesforce Commerce Cloud (for commerce), and Salesforce Service Cloud (for customer service). In that case, you have three independent systems, each with its own database. Your data is not unified.

CDPs emergence is due to scattered data. These CDPs on the shelf are just ETL tools designed to build data pipelines and synchronize data between applications.

They work similarly (Extract – Transform – Load) with the same limits: pipelines are expensive to set up &maintain, and subject to leaks.

Cloud data warehouse solutions have great advantages

And then came cloud platforms, BigQuery, Snowflake, offering a radically different approach. These technologies allow you to build your unified database in the cloud and work like a CDP…without pipelines.

Connecting a data source to your Data Warehouse BigQuery is all about adding the right permissions to your data source’s BigQuery API key.

Connecting data becomes incredibly simple:

  • There’s no data migration.
  • Storage is no longer a problem; your DWH can put a potentially infinite volume of data without requiring any maintenance.
  • A cloud platform is an open system that makes it easy to add third-party tools to your infrastructure, unlike CDPs on the market, which confine themselves to a rigid environment.
  • The computing power offered by the DWH Cloud solutions is much higher than what CDP solutions on the market offer.
  • You can centrally and granularly manage rights and access in a DWH Cloud.
  • Third-party applications can access large amounts of data and query it as much as they want without impacting its operation and availability.
  • The data connection causes no leaks (because there are no pipes) and no synchronization lags.

The time where tool stacking meant data stacking might soon be a bad memory.

Building your CDP in your Data Warehouse allows you to easily connect your data sources, unify this data and then redistribute it to business applications.

This approach makes it possible to build a “platform” in the strict sense of the term, not a software suite.

Conclusion

A business that wants to get more out of its customer data and a good technology solution should consider the hybrid alternative presented. No, off-the-shelf CDP is not the only option. No, you don’t necessarily have to choose between Buy and 100% Build approaches.

The DWH first approach is growing in popularity to the delight of the major cloud platforms… The three-digit growth of an actor like Snowflake is emblematic of this major development. To be continued!

Reverse ETL – Definition & analysis of this new category of tools

ETL (or ELT) solutions allow you to extract data from different applications and put it into a data warehouse. Reverse ETL processes, on the other hand, allow you to extract data from the data warehouse to feed all sorts of applications: CRM, advertising tools, customer service, etc.

The potential is enormous; reverse ETLs allow you to have a single source of truth for most business applications, which means no more recurring problems reconciling data from tool A to tool B, or managing flows between different applications.

Why is this type of solution emerging now if the potential is so significant?

Historically, the data warehouse is only the foundation of BI (Business Intelligence). It is used to build reports and large ad hoc queries that are not critical.

If you asked a CIO in the 2000s, it would be an aberration to supply a CRM, a critical application that uses hot data, from a data warehouse.

The new generation of cloud data warehouses (Snowflake, Google BigQuery, AWS Redshift, ..), and the ecosystem that goes around it, change the rules of the game.

The modern cloud data warehouse can become a complete operational repository because it’s much more powerful, easier to maintain, and adapted for all types of queries.

But reverse ETLs are the missing link to make it all happen.

This comprehensive guide will explain everything you need to know about this new element of the modern data stack.

What is reverse ETL? [Definition]

Reverse ETL genealogy: in the beginning was ETL

Reverse ETL is a new family of software that already plays a key role in the modern data stack. But to understand what a reverse ETL is, you first need to understand what’s an ETL because reverse ETL is a result of ETL.

The concept of ETL emerged in the 1970s.

google trends etl world
Source : Google Trends.

ETL stands for Extract, Transform & Load. Before assigning a family of tools, ETL designates a process that tools of the same name can accomplish.

ETL is the process of Extracting data from the organization’s different data sources, Transforming it, and finally Loading it into a Data Warehouse.

ETL tools are used to build the data pipeline between the data sources and the database in which the data is centralized and unified.

The data sources can be:

  • events from your applications,
  • data from your SaaS tools,
  • your various databases,
  • and even from your data lake.

ETL tools develop connectors with the primary data sources to build the data pipeline.

fivetran connecteurs
Fivetran offers over 150 connectors to data sources.

In the past, ETLs were heavy On-Premise solutions, running on heavy Data Warehouses installed on the company’s servers.

But with the advent of Cloud Data Warehouses (in 2012, with Amazon Redshift), a new category of ETL software has emerged: Cloud ETLs.

The cloudification of data warehouses, ushered in by Amazon, has led to a cloudification of ETL tools.

The two emblematic examples of Cloud ETL tools are Fivetran and Stitch Data.

Besides loading data into the data warehouse (or DWH – the destination), ETLs are also used to transform it before integrating it into the database. So it’s not just a data pipeline, but also a laboratory.

We can now understand what’s reverse ETL.

Reverse ETL is a solution for synchronizing DWH data with your business applications

In short, the ETL tool allows you to bring data from your different sources into the DWH to centralize and unify the company’s data. This data is then used to perform data analysis: Business Intelligence.

Reverse ETL has an inverted function of ETL, it is the technological solution that allows you to transfer centralized data from the data warehouse to business applications.

Reverse ETL finally solves a nagging problem encountered by companies.

They normally manage to centralize data in the data warehouse smoothly due to Cloud ETL, but once this data is in the DWH, it’s difficult to get it out of the database and use it in business tools.

Though ETLs are used for BI, they’re rarely used to feed business applications in the absence of simple synchronization solutions; this is where Reverse ETL comes into play.


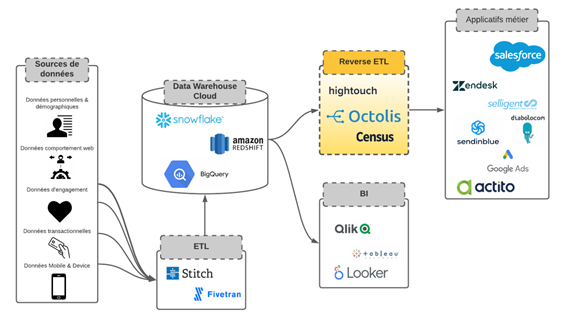
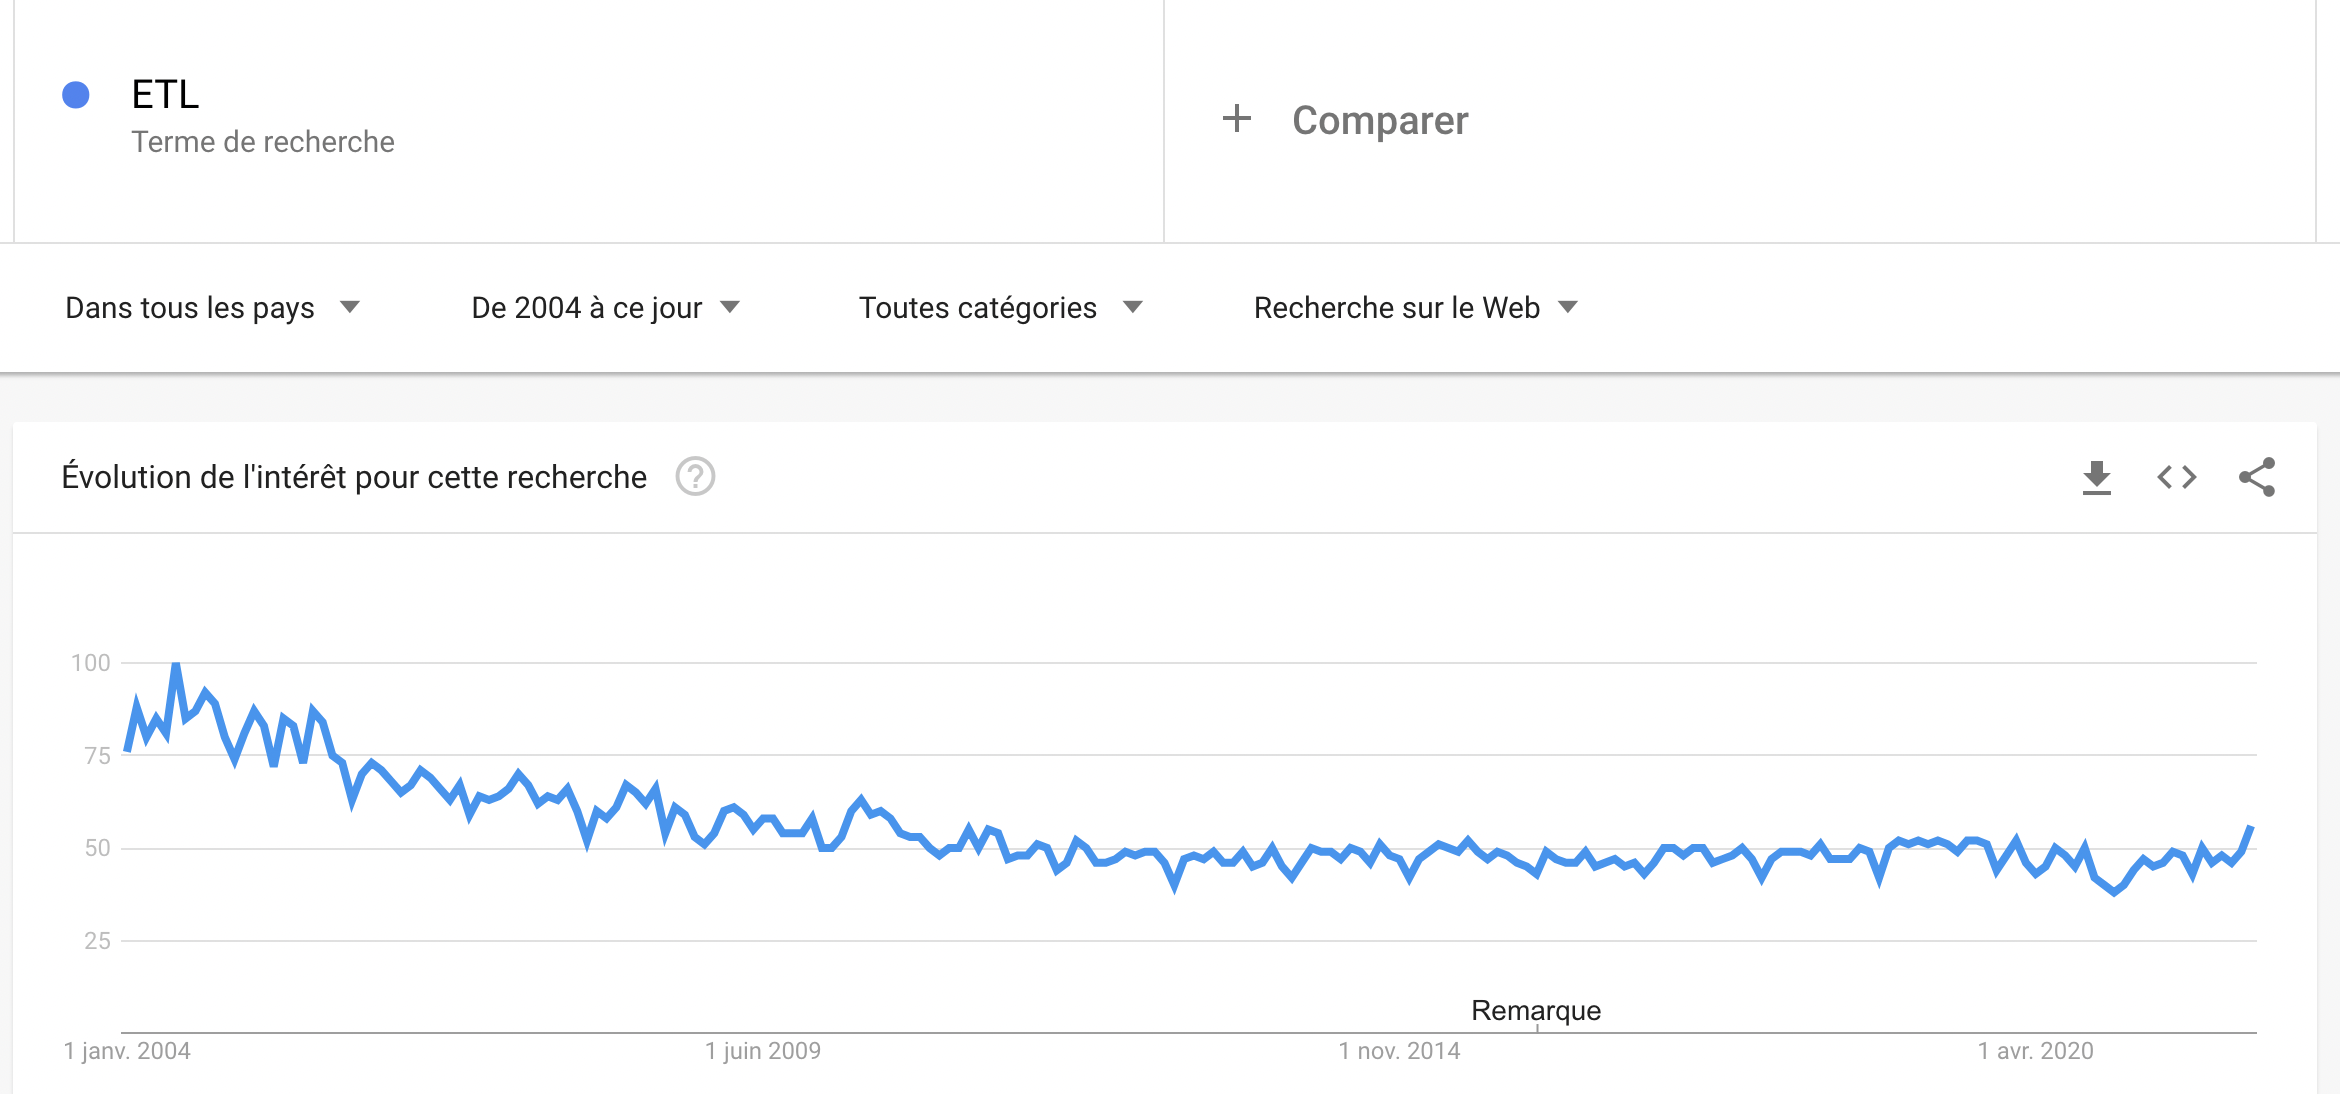
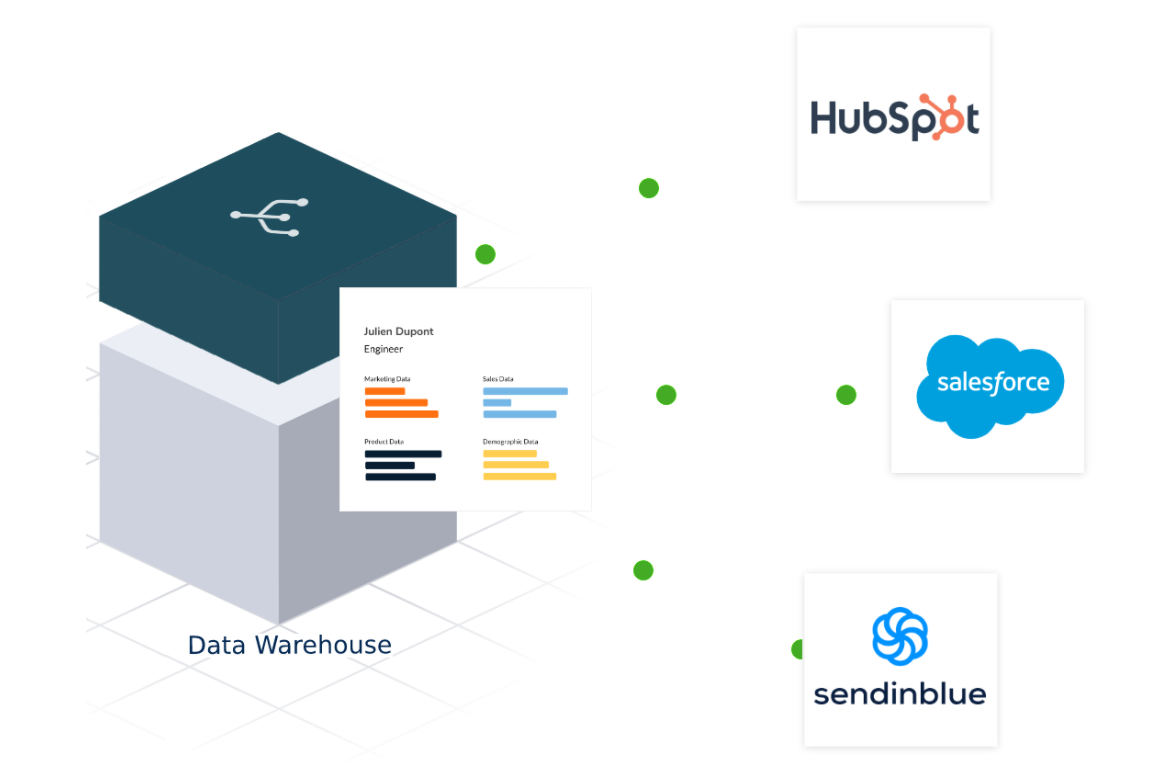
Reverse ETL is a flexible data integration solution for synchronizing DWH data with applications used by marketing, sales, digital team, and customer service, to name a few.

Like Cloud ETL tools, flexibility and ease of use characterize reverse ETLs. Data is processed, transformed, mapped, and synchronized in the business applications using connectors and modulo SQL work.

Without using SQL queries, reverse ETLs allow you to edit the data flows from a visual interface. You choose the database column or table you want to use and create the mapping from the visual interface to specify where you want the data to appear in Salesforce, Zendesk, and so on. No more scripts or APIs.

Once the flow is set up, the data is synchronized in the applications, not in real-time, but in very short batches of about a minute.

Reverse ETLs, such as Octolis, are based on an approach known as “tabular data streaming” instead of the “event streaming” approach. What reverse ETL does is copy and paste tables from the source system (the DWH) into the target system (the business application) at very regular intervals.

Like ETL tools, reverse ETLs are not only data pipelines. They allow you to transform the DWH data and prepare it – i.e., clean the data, create segments, audiences, scorings, and build a unique customer repository.

So why are Reverse ETL solutions so popular today?

Now that we know what Reverse ETL is and how it works schematically, let’s dive deeper into the “why.”

Why do we want to get data out of the DWH?

It took years for companies to centralize and unify their data in a master base: the Data Warehouse Cloud.

Yet many companies are not there and still don’t have a single repository.

But why would you want to get the data that you have carefully centralized in the data warehouse out?

First of all, it is essential to remember that the data remains in the data warehouse in any case. Reverse ETL synchronizes data sets in business applications without moving them. Synchronizing does not mean migrating.

What reverse ETL does is to put this centralized DWH data at the service of business applications.

It is well known that medicine is both a cure and poison. Until now, DWH has been used as a remedy for data silos. But in many companies today, data is siloed in the data warehouse.

Without reverse ETL, the data stored in the DWH is slightly used or not used at all by the business applications.

What is the data used for? As we mentioned above, to do BI and dashboarding.

Thanks to all the work done with SQL, DWH leads to the creation of interesting definitions and aggregates of data: lifetime value, marketing qualified lead, product qualified lead, heat score, ARR, etc. But this business-relevant data is not used directly by the business teams and the tools they use.

With reverse ETL, you can use these definitions, and the associated columns in the DWH, to create customer profiles and audience segments.

stack data moderne
Modern Stack Data with the Cloud Data Warehouse at the core of the system.

With reverse ETL, the data warehouse is no longer just used to feed BI; it feeds business applications directly.

The reverse ETL was the missing piece of the data stack; the piece that prevented this data stack from being truly modern.

What are the use cases of a reverse ETL?

Let’s look closely at the use cases that the reverse ETL tool makes possible.

There are essentially three types of use cases:

#1 Operational Analytics

This new term refers to a new way of looking at analytics.

In the Operational Analytics approach, data is not only used to create reports and analyses but is also smartly distributed to business tools. It is the art to make data operational for business teams by integrating it into their daily tools.

If you think about it, this approach allows you and your teams to become data-driven in all decisions and actions. It’s smooth, easy, headache-free, and doesn’t involve reading indigestible BI reports.

How do you deploy this “Operational Analytics” approach? And how to become data-driven? By using reverse ETL, of course!

Reverse ETL allows you to transform data into the analysis (segments, aggregates) and analysis into action.

Imagine a salesperson who wants to know the key accounts, those on which to focus his efforts?

In the classic, old-fashioned approach, we call on a data analyst who will use SQL to identify high-value leads in the DWH and then display it all in a nice BI table…that no one will read or use.

You can train salespeople to read dashboards and reports, but in practice, it’s always complicated, which holds back many organizations from becoming data-driven. This difficulty in making data and analysis available to business teams prevents the full exploitation of the data available to the company.

With the Operational Analytics approach, there’s no need to train salespeople to use BI reports; the data analyst directly integrates the corresponding data from the data warehouse into a Salesforce custom field.

Reverse ETL allows a data analyst to deploy Operational Analytics as easily as creating a report.

#2 Data flow automation

Reverse ETL allows you to quickly and automatically provide business teams with the data they need at a specific time. Not only does it provide business teams with the data they need in their tools, but it also facilitates the work of data analysts and other data engineers.

For example, if your sales team asks IT which customers are at high risk of churn, reverse ETL makes it easy to answer without spending excessive time extracting data from the DWH.

We could also take the examples:

  • A salesperson who wants to visualize the customers with a lifetime value higher than X€ in Salesforce
  • A customer advisor who wants to see the accounts that have opted for premium support in Zendesk
  • A product manager who wants to access Slack feedback from users who have deployed a particular feature
  • An accountant who wants to synchronize customer attributes in his accounting software.
  • And so on.
Reverse ETL’s use cases.

Reverse ETL allows you to easily and automatically manage these everyday business requests that used to be the hell for the IT team.

In this sense, it addresses a recurring concern in organizations: communication, or rather miscommunication, between IT and business teams.

Harmony between IT and the business is restored without designing APIs.

#3 Reverse ETL, a solution to the increasing number of data sources

One of the modern data stack challenges is to manage the proliferation of data sources. But reverse ETL allows you to take advantage of this formidable data gold mine to create a memorable customer experience.

It serves both purposes:

  • For the customer: Offer them a richer and more relevant experience thanks to more personalized actions (targeted content, distribution channel, and production time). It generates more customer satisfaction.
  • For the company: Increase customer retention and revenue per customer.

Reverse ETL enables the transformation of customer knowledge produced by DWH and BI into an enriched experience for the customer.

Two alternatives to reverse ETL software: Customer Data Platform & iPaaS

There are alternatives to reverse ETL software; our article would not be complete without mentioning them.

Reverse ETL vs. CDP

Customer Data Platforms have been gaining momentum since the mid-2010s. A CDP is an off-the-shelf platform that allows you to build a single customer repository by connecting all of the organization’s data sources. As such, CDP is an alternative to the data warehouse.

The advantage over the data warehouse is that CDP is not just a database for BI purposes; the CDP offers advanced functionalities to:

  • Prepare data for business use cases: segmentation, creation of aggregates, scores, etc.
  • Redistribute it, via native or tailor-made connectors, to business applications.

In short, CDP plays the same role as DWH and reverse ETL. In fact, you don’t necessarily have to choose between CDP and DWH. The same company can indeed combine:

  • A Data Warehouse that will be used for BI.
  • A Customer Data Platform that will enable customer data to be activated and made available to business teams.

Compared to the Data Warehouse – reverse ETL combination, the Customer Data Platform is characterized by:

  • Greater rigidity. The CDP imposes its data models and limits the creation of customized models.
  • CDP is a costly solution, inaccessible to most small and medium-sized businesses.
  • CDP does not promote communication between IT and business teams. CDP is designed for business teams and especially for marketing.

The publishers’ objective is to make the business teams autonomous from IT. But in our opinion, the challenge is to make communication between IT and the business more fluid; not to destroy it.

To deploy complex data use cases, IT has a role to play.

That’s why we prefer the approach of combining the data warehouse with a reverse ETL tool. It offers more flexibility. In short, reverse ETL transforms your data warehouse into a Customer Data Platform.

Reverse ETL vs. iPaaS

An iPaaS is an integration solution in SaaS mode: Integration Platform as a Service. Integromat is probably the most iconic iPaaS solution on the market today.

iPaaS solutions generally offer easy-to-use, visual interfaces that connect applications and data sources.

The way it works is similar to reverse ETL: You select a source, select a destination tool, and edit the mapping to define where the data from the source will fit into the destination tool (the location and the “how”).

The example below shows the design of a mapping between emails and Google Spreadsheet:

Integromat Email Integration GSheets
Integromat – Email Integration – GSheets.

There is no need for APIs, scripts, or SQL, so iPaaS solutions are popular with non-technical people.

An iPaaS allows you to create 1:1 data flows directly between the sources and the destination without going through the data warehouse.

For this reason, iPaaS can be used by companies with limited data integration needs. But it’s not the preferred option for companies that want to build an IT infrastructure around a database that acts as a hub.

Conclusion

The most advanced companies in terms of data already use reverse ETL. And it’s destined to become the norm in companies that wish to exploit their data better. It is a solution that allows you to better use the data stored in the data warehouse.
We will come back in more detail on the issues surrounding this essential data brick.

Why do we launch Octolis?

First user test after months of development

We are delighted to announce the official launch of Octolis in January 2022.

To avoid the disappointment experienced by the creator of that labyrinth, we have based the development of Octolis on our clients’ feedback.

We’ve had customers using the product’s first version for almost a year now, including major brands like KFC and Le Coq Sportif. We’ve been quiet while working hard with a few customers for months to improve our product, over and over again.
And now, the time has come! Octolis is now available to all companies who want it!

We have a lot to say about why we launched Octolis. But if you don’t have time to read it all, here’s what you can take away in a nutshell:

  • We believe that the growth of modern cloud data warehouses will profoundly transform organizations. When all the company’s data is stored in a warehouse, you can use this warehouse to manage all your teams and sync all your tools. Octolis acts as a sort of data logistician.
  • We will enable small businesses (SMBs) to become genuinely “data-driven”. Not to create reports that are barely used, not to create yet another machine learning POC that will never be put into practice, but to improve everyday operations.
  • We have developed the data management solution we wish we had in our previous experiences. It’s a simple enough solution to be used by marketers and flexible enough for tech/data teams.

The standard issue of data silos

Clément and I met at Cartelis, where we have been data consultants for years. We had the chance to work for companies of various sizes and levels of digital awareness, from great start-ups like Openclassrooms, Blablacar, or Sendinblue, to more traditional companies like RATP, Burger King, or Randstad.

In almost all the companies we worked for, there were significant challenges around customer data reconciliation.

The problem is simple, all teams would like to have as much information about their customer as possible, within the tools they use daily.

For example, sales teams want to see in their CRM software if the customer has used the product recently so they can trigger a follow-up at the right time. Marketing teams want to set up fully automated messages after a customer has complained to customer service or visited a specific page on the website. And customer service wants to prioritize client tickets based on the potential risk of losing a customer, just to name a few.

The tools that allow you to interact with your prospects/customers are more and more powerful, but they are under-exploited because it is difficult to sync them with all the data you need. The main reason is that we have valuable data everywhere. Interactions between the company and its customers happen on several channels and tools (e.g., mobile application, automated chat, marketing automation, advertising retargeting, customer service, etc.). These sources generate a phenomenal amount of data that businesses can use to personalize customer relationships.

Most companies start by trying to bind all of their tools to address this challenge; new connections are then established with apparently simple-looking tools like Zapier or Integromat, but shortcomings start to become evident when trying to manage them all at once or trying to scale.

Then comes the moment when we judge that it is time to centralize all customer data in the same place, we list the many advantages (customer knowledge, project acceleration, etc.) to justify the potential ROI, then fix a specific budget and finally, decide to launch a complex “Unified Customer Repository” or a “360° customer database” project, which can be pretty daunting and intimidating, to say the least.

The big question is, what format will this customer repository take? The main options considered most of the time are:

  • An already existing solution: CRM or ERP
  • A tailored made database (usually with an in-house team for support)
  • A software solution dedicated to this objective: “Customer Data Platform.”


However, this can be easily and cost-effectively solved with the new generation of data warehouses.

Historically, a data warehouse was a database that supported analysis, not operational uses. Solutions were built to support large punctual queries, with data updated once a day at most. Now, modern data warehouses can support all types of queries, in almost real-time, at a more competitive price, and with no maintenance effort. This changes everything.

The modern data stack creates a new paradigm

In the last few years, the major shift has been the emergence of a new generation of cloud data warehouses like Snowflake, Google BigQuery, Firebolt. Snowflake’s historic IPO in 2020 – with a valuation that continues to increase – is the financial reflection of this significant breakthrough, and yet, Oracle, IBM, and Microsoft have been offering data warehousing solutions for years. So what has changed?

The new generation of cloud data warehouses provides 3 significant advantages:

  • Speed/power: Phenomenal computing power compared to 2010 standards can be achieved in a few clicks.
  • Price: Decoupling storage and data processing has significantly reduced storage costs. Depending on the queries you make, you pay per use, but storing large volumes of data costs almost nothing.
  • Accessibility: Implementation and maintenance are more straightforward. It’s no longer necessary to have a team of network engineers to manage a data warehouse.

If you want to know more about data warehouses, here is an excellent article about it written by our friends at Castor.

Thanks to these innovations, cloud data warehouse adoption is booming, and a whole new ecosystem is emerging around it, including:

  • Extract Load (Transform) tools like Airbyte or Fivetran to sync the data warehouse with data from all internal applications.
  • Tools like DBT to transform data directly into the data warehouse.
  • Tools like Dataiku to perform data science projects directly in your data warehouse.
  • Reporting tools like Metabase or Qlik
  • And now software activation tools (or reverse ETL) like Octolis to enrich operational tools with data from the data warehouse.

You can learn more about the modern data stack in this article.

The modern data warehouse becomes a foundation for analysis and operations

It is now possible to use the data warehouse as an operational repository because it’s easy to build in it a Customer Data Platform equivalent. Some experts call this the Headless CDP approach. It is a growing trend in mature enterprises, which will significantly impact the entire SaaS value chain.

In this article, David Bessis, the founder of Tinyclues, insists that this shift will limit the dependency on full-featured software solutions offered by Adobe, Salesforce, or Oracle. This may explain why Salesforce has invested significantly in Snowflake…

  • There are many advantages to using the data warehouse as the foundation for operational tools.
  • Limit data integration/processing work: We import the data in one place, transform it once, and use it everywhere afterwards.
  • Keep control of the data, and facilitate the transition from one software solution to another.
    Align analysis and action; the same data is used to report and populate the tools. When an analyst calculates a purchase frequency, this can also be used in CRM or emailing tools.

This allows companies to speed up many previously complex projects. For instance, the classic use cases of a “Customer Data Platform”:

  • 360-degree view of each prospect/customer including all the interactions associated with each individual.
  • Advanced segmentation/scorings that can be used in marketing tools.
  • Use “first party” data in acquisition campaigns to create and target best customers look alike audiences, follow-up after no response, or use LTV as an indicator of campaign success.

Other examples include use cases that are less focused on customer data, such as:

  • Enriching a product recommendation engine with available product stock or margin per product.
  • Creating “web events” from phone calls or offline purchases to have a complete view of customer cycles in web analytics tools.
  • Generating Slack alerts when an Adword campaign is incorrectly set up or a lead is poorly completed in Salesforce.

Until now, companies that used their data warehouse for operational purposes set up custom connectors to send data to their different business tools. These connectors can be quite complex to implement because they deal with data format incompatibility issues, batch or real-time flows, API quotas, and more; and you also have to keep these connectors in place once they are set up.

A new category of tools is emerging to facilitate data synchronization from the data warehouse to business tools. Even if the term has not yet been agreed upon, the concept of “Reverse ETL” is most often used to refer to these tools.

Octolis allows all SMEs to effortlessly exploit the data from their existing tools

Unlike medium-sized companies, most mature start-ups or large companies with data engineers have already implemented this type of architecture. This will grow at full speed in the next few years.
The ecosystem around the “modern data stack” has matured a lot, and decision-makers are increasingly aware that data maturity is a priority in the coming years.

But the barrier is often human; data engineering skills are rare and expensive.

Octolis wants to become the benchmark solution for small and medium-sized companies that wish to take their data to the next level without having a team of data engineers.

We offer a turnkey solution that allows to:

Centralize data from different tools in a data warehouse
Cross-reference and prepare data efficiently, to have nice reference tables with customers, purchases, products, contracts, stores, etc.
Synchronize data with operational tools: CRM, Marketing Automation, Ads, Customer Service, Slack, etc.

octolis platform

At Octolis, we believe companies can give autonomy to marketing teams while leaving a certain level of control to IT teams.

The Octolis software interface is simple enough for a marketer to cross-reference/prepare data and send it wherever needed. But this simplicity does not mean that it’s a black box, the data is accessible by the IT teams at any time, hosted in each client’s database or data warehouse, and connected to a reporting tool.

With Octolis, an SME can have a solid base to set up its reporting and accelerate all its marketing/sales projects.

The potential is enormous, and the use cases are innumerable. We get up every morning highly motivated to further improve the product and help our clients fully exploit their data’s potential!