Customer scoring helps you prioritize your marketing budgets for the customers most likely to buy. It also helps segment your customer file better to obtain greater performance in your campaigns.
For instance, it will help you identify your most persuasive promoters and make them your champions.
In this article, we present 3 concrete examples of customer scoring models. We also offer you a 5-step guide to building a customer scoring that is effective and quickly usable.
Definition of Customer Scoring
Companies use these value analysis methods to define which customers are sources of significant profits. The goal: use the information collected to communicate effectively with these most valuable segments. The RFM (Recency, Frequency, Monetary) model is one of the most commonly used methods.
The main advantage of the RFM method is that it gives detailed information about these customers using only three criteria. This reduces the complexity of the customer value analysis model without compromising its accuracy.
Customer scoring is not strictly limited to active customers. Inactive customers can turn out to be an essential segment of customer scorecards.
Scoring client VS Lead scoring
| Criteria | Customer scoring | Lead scoring |
|---|---|---|
| Objective | Retention, upsell, maximization of the LTV of existing customers | Acquisition of new customers |
| Operation | Analysis of a stock (usually large) of past data | Continuous updating of a score in flow to each action of a prospect |
| Team concerned | Marketing | Commercial |
| Approach | Definition of mutually exclusive segments | Grading of prospects on a more or less linear scale |
Lead scoring seeks to estimate the expected gain on a prospect with two types of variables:
It is mostly used in B2B to help sales teams maximize their expectation of gains. They prioritize leads with the most significant potential and the strongest purchase intention.
Instead, customer scoring aims to segment an existing customer base (stock) into mutually exclusive segments. The principal challenge is not prioritizing the segments to be worked on but defining appropriate marketing actions that will maximize customer value within each segment.
A straightforward example: imagine you offer a 10% coupon simultaneously to all your customers:
Customer scoring helps target only the right segment (the 2nd in our example) and consider different actions for the other segments. For example, you can offer an upsell to the former and ask the latter for their opinion on their purchase.
Customer scoring and Pareto’s law
The RFM model is linked to the famous Pareto’s law, which states that 80% of the effects are the product of 20% of the causes. Applied to marketing, 80% of your sales come from 20% of your (best) customers.
The RFM Model: A Standard for Customer Scoring
Traditional segmentation methods used by market research firms before the advent of data analytics use demographic and psychographic factors to group their customers.
Researchers still use samples to predict the overall behavior of a population. This prevents the definition of precise segments.
These studies are done manually, depend on skilled researchers, and are subject to human error. Therefore, a sample can be incorrect for many reasons: an insufficient number of consumers, a bad ratio between the different populations, variable psychographic factors, etc.
RFM segmentation is one of the most popular tools for rating customers based on their previous purchases. It is especially used by direct marketers.
With this RFM analysis, they can not only score each customer (which is very useful in its application later) but also predict the behaviors of each segment towards future marketing campaigns.
Campaigns can be planned more accurately and therefore become more profitable.
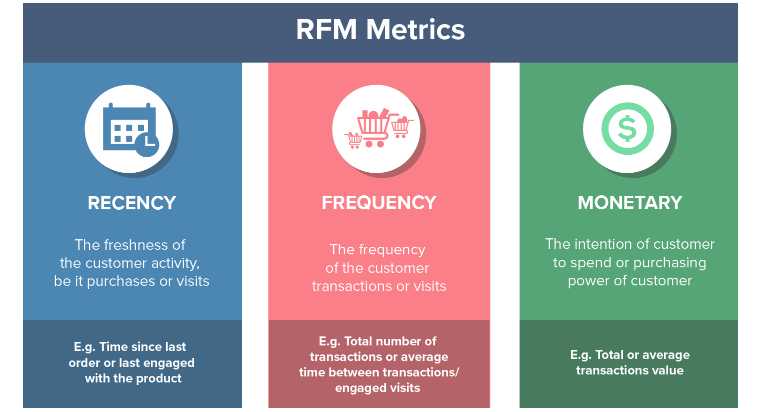
Recency
How long has it been since the last purchase? The shorter the time, the higher the customer value.
The first step should be to divide the entire customer base into 3, 4, or 5 equal segments.
The maximum value is awarded to 20, 25, or 33% of customers who made purchases most recently. The minimum value is assigned to customers whose last purchase was made least recently.
Frequency
How often has the customer shopped at the store? The higher the purchase recurrence, the higher the customer value.
On a basis divided into 5 segments for the date of the last purchase, we again divide the customers into 5 equal groups according to the number of purchases they have made since the beginning of the relationship with your brand.
Monetary (Value)
How much did the customer pay in the store? Of course, the higher the spending, the higher the customer value.
Now it’s time to move on to the final part of the analysis – determining how much the customer spent on your products in total. As in the previous segmentation, it is recommended to use a scale of 1 to 3, 4, or 5 in this case.
The RFM model limitations
The main RFM limitation is that it does not allow the evaluation of the potential of a new customer because the seniority of customers is not taken into account. A customer who became a customer yesterday will have much less value than the oldest customers in this model.
3 examples of customer scoring
1. AnalyticsVidhya’s 3×3 RFM segmentation
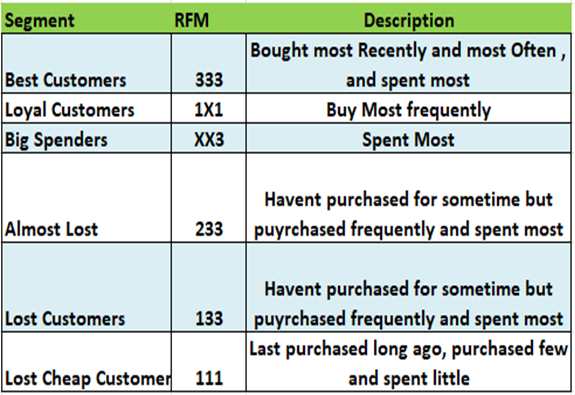
It is possible to group customers according to the 3 factors set out above. For example, group all customers whose seniority is less than 60 days in the same category. Similarly, customers with seniority greater than 60 days and less than 120 days in another category. We will also apply the same concept to Frequency and Value.
Vidhya themselves set ranges for each score based on the nature of the activity. Ranges for frequency and monetary values will also be defined this way.
In this rating method, it is up to each company to establish the range it considers relevant for the recurrence, frequency, and monetary values. Note, however, that ranges are not fractiles/quantiles.
The big advantage is that it is straightforward to set up. But calculating such a range for RFM scores also has limitations:
2. Putler’s RFM segmentation
| Customer segment | Referral score | Frequency score | Description | Marketing action |
|---|---|---|---|---|
| Champion customers | 4-5 | 4-5 | They bought recently, buy often, and spend the most! | Reward them. They can be early adopters of new products. They will promote your brand. |
| Loyal customers | 2-5 | 3-5 | Often spend money with you. Respond to promotions. | Sell more expensive products. Ask them for opinions. Engage them. |
| Future loyal customers | 3-5 | 1-3 | Recent customers, but who have spent a lot of money and bought more than once. | Offer a membership/loyalty program, recommend other products. |
| Recent customers | 4-5 | 0-1 | They have purchased very recently, but not regularly. | Help them fit in, give them rewards fast, start building a relationship. |
| Promising customers | 3-4 | 0-1 | They are recent buyers but have not spent much. | Create brand awareness, offer free trials. |
| In need of attention customers | 2-3 | 2-3 | Fairly recent on average, they have an above-average purchase frequency and monetary value. They may not have bought very recently though. | Make limited-time offers, Recommend based on past purchases. Reactivate them. |
| Passive customers | 2-3 | 0-2 | Below average in terms of novelty, frequency, and money. You will lose them if you do not reactivate them. | Share valuable resources, recommend popular products / discounted renewals, reconnect with them. |
| At-risk customers | 0-2 | 2-5 | They spent a lot and bought often. But a long time ago. We must bring them back! | Send personalized emails to reconnect, suggest new things, provide useful resources. |
| Indispensable customers | 0-1 | 4-5 | They made the biggest purchases, and often. But they haven't been back for a long time. | Recover them with a renewal of the offer or by offering them new products, do not lose them to the profit of other competitors, talk to them. |
| Customers in hibernation | 1-2 | 1-2 | The last purchase is dated. They are the ones who spend little and have the lowest number of orders. | Offer other relevant products and special discounts. Recreate brand value. |
| Lost customers | 0-2 | 0-2 | The recency, frequency, and money scores are the lowest. | Rekindle interest with an awareness campaign, ignore it otherwise. |
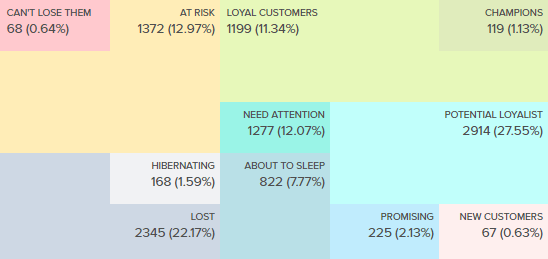
Quintiles work with any industry since the ranges are chosen from the data itself. They distribute customers evenly so that there is no overlap.
R, F, and M here have scores from 1 to 5, so there are 5x5x5 = 125 RFM value combinations. The three dimensions of R, F, and M can be represented on a 3D graph. If you want to determine how many customers you have for each RFM value, you need to look at 125 data points.
In this approach, one should plot Frequency + Money Score on the Y-axis (range 0-5) and Seniority (range 0-5) on the X-axis. This narrows down the possible combinations from 125 to 50.
It makes sense to put F and M into one combination, as both are related to the customer’s purchase volume. On the other axis, R gives us a quick look at levels of re-engagement with the customer.
3. Barilliance’s 4 RFM segments
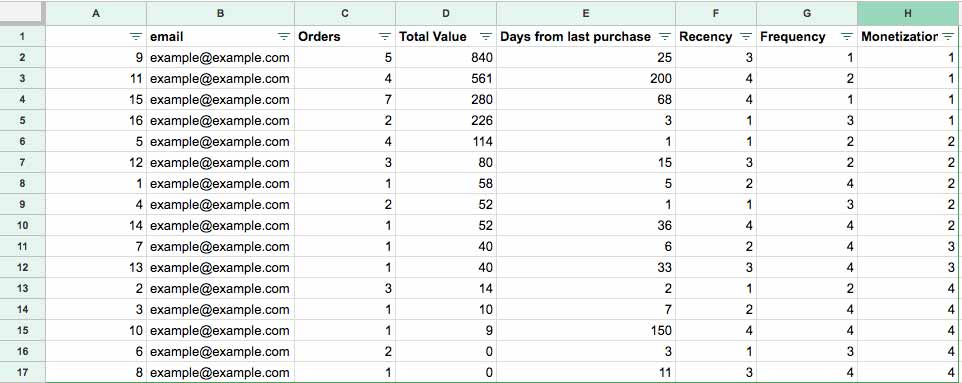
Note that the scores are reversed this time: 4 is the minimum value, and 1 is the maximum value.
| Customer segment | RFM | Description | Marketing action |
|---|---|---|---|
| The hardcore - Your best customers | 111 | Highly engaged customers who have purchased your products recently, most often, and generated the most revenue. | Focus on loyalty programs and new product launches. These customers have proven they are willing to pay more, so don't offer discounts to generate additional sales. Instead, focus on high value actions by recommending products based on their previous purchases. |
| The loyal - Your most loyal customers | X1X | Customers who buy most often from your store. | Loyalty programs are effective for these repeat visitors. Engagement programs and evaluations are also common strategies. Finally, consider rewarding these customers with free shipping or other such perks. |
| The whales - Your highest paying customers | XX1 | Customers who generated the most revenue for your store. | These customers demonstrated a strong willingness to pay. Consider premium offers, subscription levels, luxury products, or value-added cross-selling or upselling to increase total added value. Don't lose your margin with discounts. |
| The Promising - Loyal customers | X13, X14 | Customers who come back often, but don't spend a lot. | You have already succeeded in creating loyalty. Focus on increasing monetization through product recommendations based on past purchases and incentives tied to spend thresholds (set based on your store's average added value). |
| The recruits - Your newest customers | 14X | New buyers visiting your site for the first time. | Most customers never become loyal. Having clear strategies for new buyers, such as welcome emails, will pay off. |
| The unfaithful - Once faithful but now gone | 44X | Great old customers who haven't bought in a long time. | Customers leave for a variety of reasons. Depending on your situation, suggest price offers, new product launches, or other loyalty strategies. |
5 steps to build a customer scoring model tailored to your business
1. Collect and collate customer data
The RFM model involves analyzing customer transaction history. For this, it is important to always keep control of customer data. The first step is to extract the RFM data for each customer in ascending order.
It is also essential to choose a time interval to analyze the transactions – for instance, the last 12 or 24 months.
To limit the impact of the acquisition of new customers on data (for example, in a context of strong growth), we can decide to study an acquisition cohort. Therefore, you must analyze all transactional data of the last 3 months, but only for customers acquired more than a year ago.
2. Define RFM bearings
Companies need to create custom filters to segment customers effectively. You need to create sample filters for better understanding, like the example below. Be careful, however, because this is an important aspect that will vary depending on the nature of your activity.
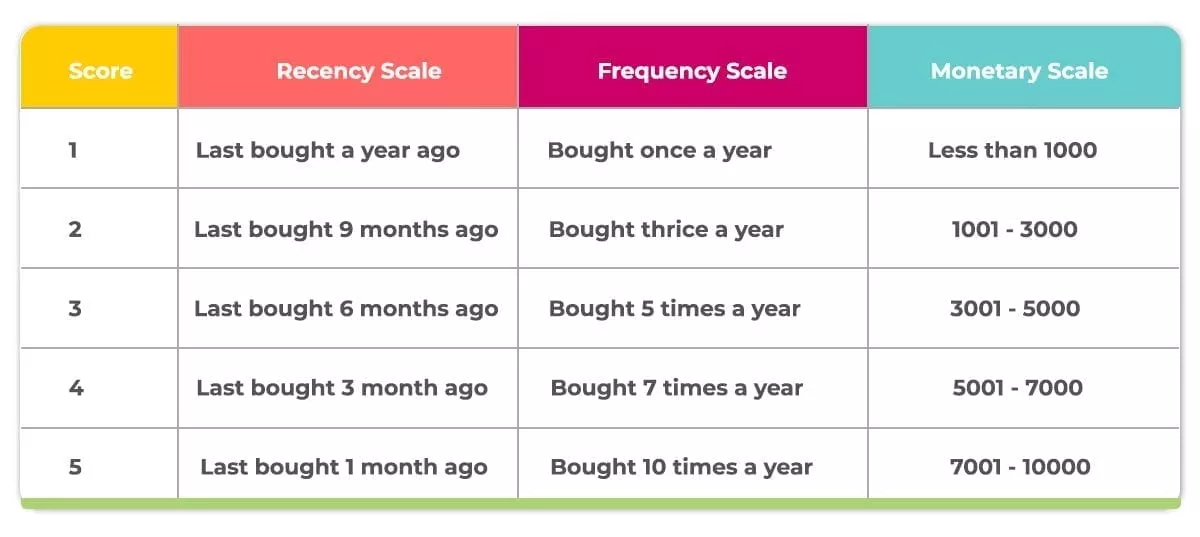
You can now assign each customer a rating based on the table above. By doing so, you convert the absolute values of transactions into blocks of similar transactions based on the RFM. Now you don’t need the absolute values mentioned in parentheses anymore and just use the score for segmentation and analysis. After assigning scores, you can create groups of similar customers with the same or similar scores in all three criteria.
4. Name the segments
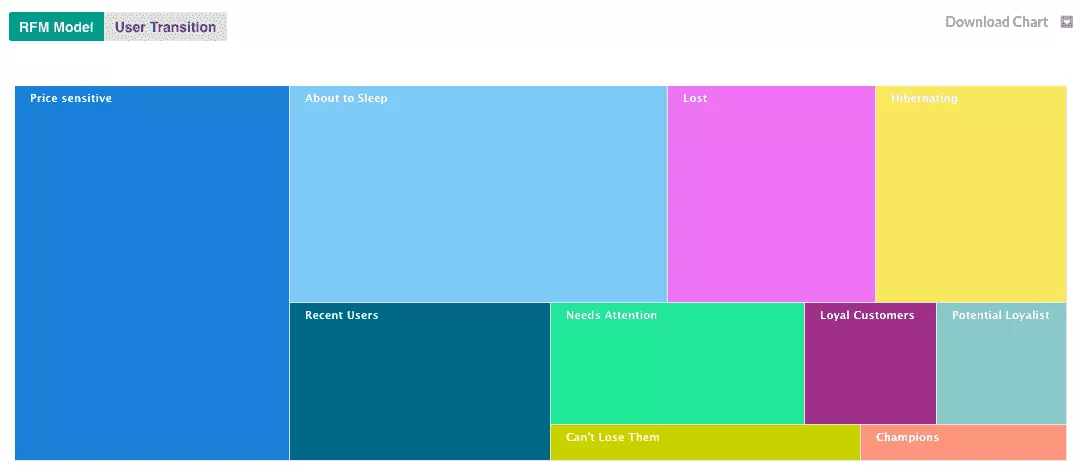
The labels used will be based on the different characteristics of the three ratings customers received. Since 5 scoring segments were used, and there are 3 criteria, there is a possibility of 5*5*5 = 125 unique segments.
You can decide how many segments you want to have. Having many segments helps to be more precise in the automation of marketing actions and represents a substantial operational cost. It’s a middle-ground game. In general, we work with about 5 to 10 segments.
5. Operationalize segmentation in your marketing actions
Once companies have segmented and labeled each customer, they can personalize their messages. At-risk customers can be targeted with offers, discounts, or freebies, while loyal customers can benefit from a higher level of service to value them more.
To build an omnichannel customer relationship, recent customers can receive information about other products that may interest them. Top customers can also benefit from wider access to products and be used as a source of information before you launch these products with other customers. Of course, all of this can be done simultaneously.
Once the RFM analysis is complete, several actions can be put in place:


