Data Analytics: How Much Does It Cost for a Small/Mid-Sized Company?

Small-mid-sized companies can expect to spend anywhere between $10,000 to $100,000 per year to do data analytics. The amount you will pay depends on the number of employees and your business needs. However, companies should set aside approximately 2-6% of their total budget for data analytics.

Data analytics is no longer a thing for only large enterprises. Today, small and mid-sized businesses also generate a sizeable amount of data. Business owners can gain helpful insight and make more informed decisions with data analytics.

This post provides everything you need to know about data analytics costs for small and mid-sized companies.

Read on to discover how much you’ll spend while optimizing your business.

The data analytics budget should represent 2-6% of your expenses

Most companies offer approximately 2-6% of their total expenses on data analytics, including tools, salaries, and services. It promises a considerable level of growth, and it has revealed that new tools are underway. These tools have been able to help convert raw and unprocessed data into insight.

Data has also grown due to the influence of the Internet of Things (IoT) and connected devices. It has increased in volume while gaining new diversity and richness. For a business to be successful, the available data network has to be optimized.

It offers the opportunity to make better-informed business decisions and refine products or services offered to provide their customers with a better experience. 

Based on a study done by SAS, it has been revealed that 72% of organizations claimed that data analytics has been critical to their innovativeness.

The difference in the performance of more prominent corporations and SMEs has been traced back to analytics as a competitive landscape. Thus, this highlights the need for data analytics.

For example, if a company has a revenue of approximately 2M$, it would require almost 100K$ every year. Ordinarily, this seems like a large amount to spend out of the revenue available, but most companies with this range barely have the required data analytics tools. However, this global estimate takes into consideration the time that would be spent on the data analysis and reports by all the teams.

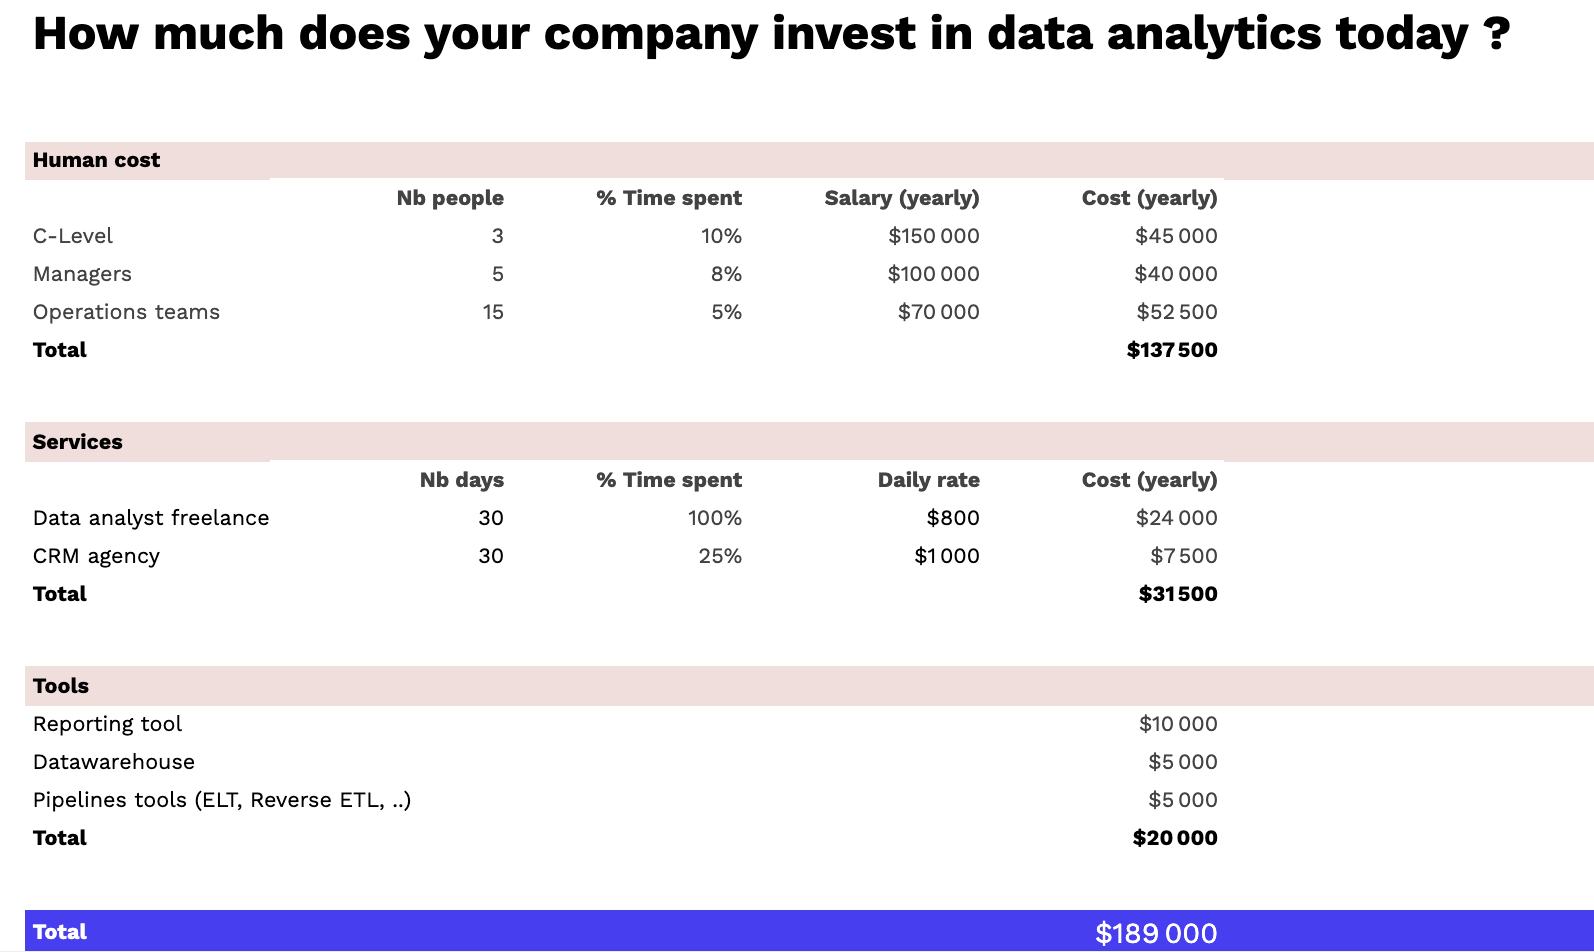
How much does your company invest in data analytics today?

Today’s cost of investing in data analytics depends on varying factors. These factors include:

  • available tools,
  • the severity of support,
  • and analytics. 

If you need to make data-driven decisions that are sufficient to provide long-term growth, then you must spend a considerable amount on data analytics.

However, investing or the intention of engaging the data analysis capacities is not sufficient in itself. 

Various options are available for consideration when engaging in data analytics, and all of this depends on your company. Thus, the human cost, services, and tools have to complement each other, as represented in the table below:
data-analytics-cost-simulation

Source

Human Cost

People are also crucial when conducting data analysis as the end goal is to influence the willingness of your customers. It is essential to look at how you source and enable the necessary talent. 

Thus, the human cost demands that you identify those who can help integrate data-driven activities within the organization.

Those who do it already have analytical skills in your company, and you can build their skills to reduce the cost of hiring experts. It involves adopting user-friendly training with tools that can be accessible to those trusted with the duties.

Small or medium-sized companies can use this to reduce human costs in the long run. Yet, you may need to get experts to start the process and train your in-house employees.

Services

Your company’s investment in data analytics has to place into perspective if it is a service acquired. There are agencies and other companies that take up the task of data analysis for other companies, which would be important in determining the cost for your SME.

For instance, you could contract a Customer Relations Management (CRM) agency to build some automated marketing workflows. In this case, the agency would spend enough time reconciling some customer data sources. It would help develop a certain level of customer knowledge to aid the analysis or some RFM segmentation and then move on to email workflows.

Just as the human cost, this workflow level would cost separately and play a vital role in your company’s money on data analysis.

Tooling

Specific essential reporting tools are used in data analysis suitable for your SME. Selecting one should begin with some popular reporting tools like Google Data Studio. The device is based on Gheet data and Google analytics, which have proven efficient in analyzing company data.

Companies still find simple BI tools helpful and purchase the Metabase or PowerBI, which leads to the next stage. The next step is to implement a basic data infrastructure with a data warehouse.

There is Google BigQuery and ETL software like Airbyte or Fivetran. These tools have licenses, and these cost differently while influencing how much your company needs to spend.

The cost of outsourcing data services vs. in-house data analysts/engineers/scientists

Data engineers cost differently based on the type of service they are offering. For many companies, an in-house data science team seems like the only option. Having a team of data analysts is ideal for big companies.

For small and mid-sized businesses, it isn’t an available solution. Most of these companies turn to outsource to start their data analytics journey.

Here is a breakdown of how much an in-house data science team costs vs. the price of outsourcing data services:

Data Analytics consulting firms

Using data analytics firms is known to be reliable due to several factors. Consultants are known for their experience in various industries. However, this makes it easier for them to deliver results faster.

An advantage of this is the level of commitment it requires compared to when having to hire a full-time employee. However, it is essential to note that these traditional consulting firms would cost approximately $50-100 per hour. In some cases, the costs are even higher, as the job would span through weeks or months.

So, engaging a consulting firm would require at least $2000 – $4000 for a week’s work. Even though this may be the first option for data analytics for your company, it may not be the most cost-efficient. It may not be a sustainable alternative as it relies on external factors.

Outsourced data analytics freelancers

Freelancers can serve the same function as consulting firms but with a lower price due to the workforce needed. It could be a single freelancer with enough experience to help analyze your company’s data. 

In most cases, it is still reliant on the project’s scope as it drives the cost of the analysis.

The project would be short-term, just as found in traditional consulting firms, which means minimal commitment. Engaging freelancers would be estimated at $1000 per week, which is considerably affordable. Outsourced freelancers can also differ in their quality, and research is critical.

However, the return on investment (ROI) and value-added to the business can not be determined. Language and cultural barriers can be a problem with outsourcing freelancers as most are in places like China and India.

This could constitute friction between your company and a data analytics service provider. Though outsourcing freelancers may help reduce spending, you must consider the differences.

In-house data analytics team

With an in-house consultant, there is someone who is always on call and has been a part of the company for a while. This provides an opportunity to have someone who is considered an outsider handling the company’s analytics. The only necessity for this to work is training the employee to understand your business and industry context.

Compared to working with consultants, this reduces the level of friction with delegated tasks. 

Finding the right analyst can be time-sensitive, obstructing the quality of service provided. 

The hiring process can also be tedious and require a commitment to ensure that you find the perfect fit.

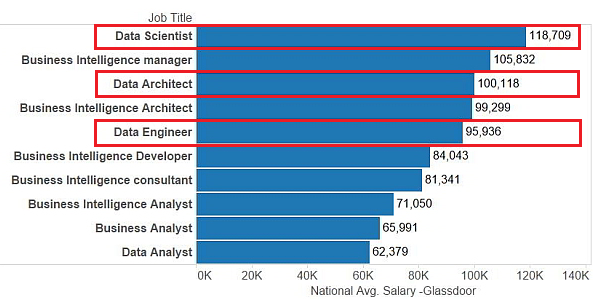
There are equal concerns that full-time analysts may become redundant during the offseason. The minimal cost of keeping an in-house specialist is approximately $60,000 compared to what other data analysts cost.
overview-of-salaries

Some may even argue that the process of hiring and integrating a new employee is for this reason. Though this is a reliable option, it would still cost the company much more.

Wrapping up

Data is critical in scaling up your business as it helps establish behavior patterns. Customer behavior, needs, and data acquired throughout running a company all contribute to the data that is to be analyzed. It improves the innovativeness of a business and provides a basis for more data-driven decisions.

These data analytical processes can be done by either an outsourcing firm, a freelancer, or an in-house team for a small or medium-sized company. Each of these options has its advantages and disadvantages. Some are more expensive than others, so they cost differently based on the budget set aside for data analytics costs.

However, companies should set aside approximately 2-6% of their total budget for data analytics. 

Data Operation tools such as Octolis can significantly lower the overall cost of data analysis. Octolis has an intelligent marketing database that would allow you to integrate your data sources and CRM tools or marketing automation.

Try out the Octolis Data Operation Tool!

How to hire your first data analyst?

Businesses deal with a ton of data every day. They use data to identify inefficiencies, opportunities, and more. However, when aggregated, data is raw and meaningless. It is insight from aggregated data that is meaningful to organizations.

A data analyst turns raw data into valuable insights that businesses need to make critical decisions. 

However, hiring a data analyst is not a walk in the park. If you get it right, your data become great assets helping you make sound business decisions. But, if you get it wrong, your data will be anything but an asset.

This article will help you get it right when hiring a data analyst. It’s a detailed “how to hire data analyst” guide that treats:

  • Identifying who you exactly need
  • Data analyst hiring process
  • How to get the best out of your data analyst.

Identifying who you exactly need

The recipe for failure is putting “a square peg in a round hole.” So, the first step to hiring the first data analyst is identifying who you exactly need. 

You need someone who fits into your organization’s needs and direction. The main discussion is whether the data analyst is required for a one-off project or on an ongoing basis. This will determine whether you should hire a part-time or full-time data analyst.

A part-time analyst will serve you if your needs include developing a particular model or analyzing a specific data set. But if your needs are making sense of a continuous inflow of datasets, you should hire a full-time data analyst.

When to hire a data analyst

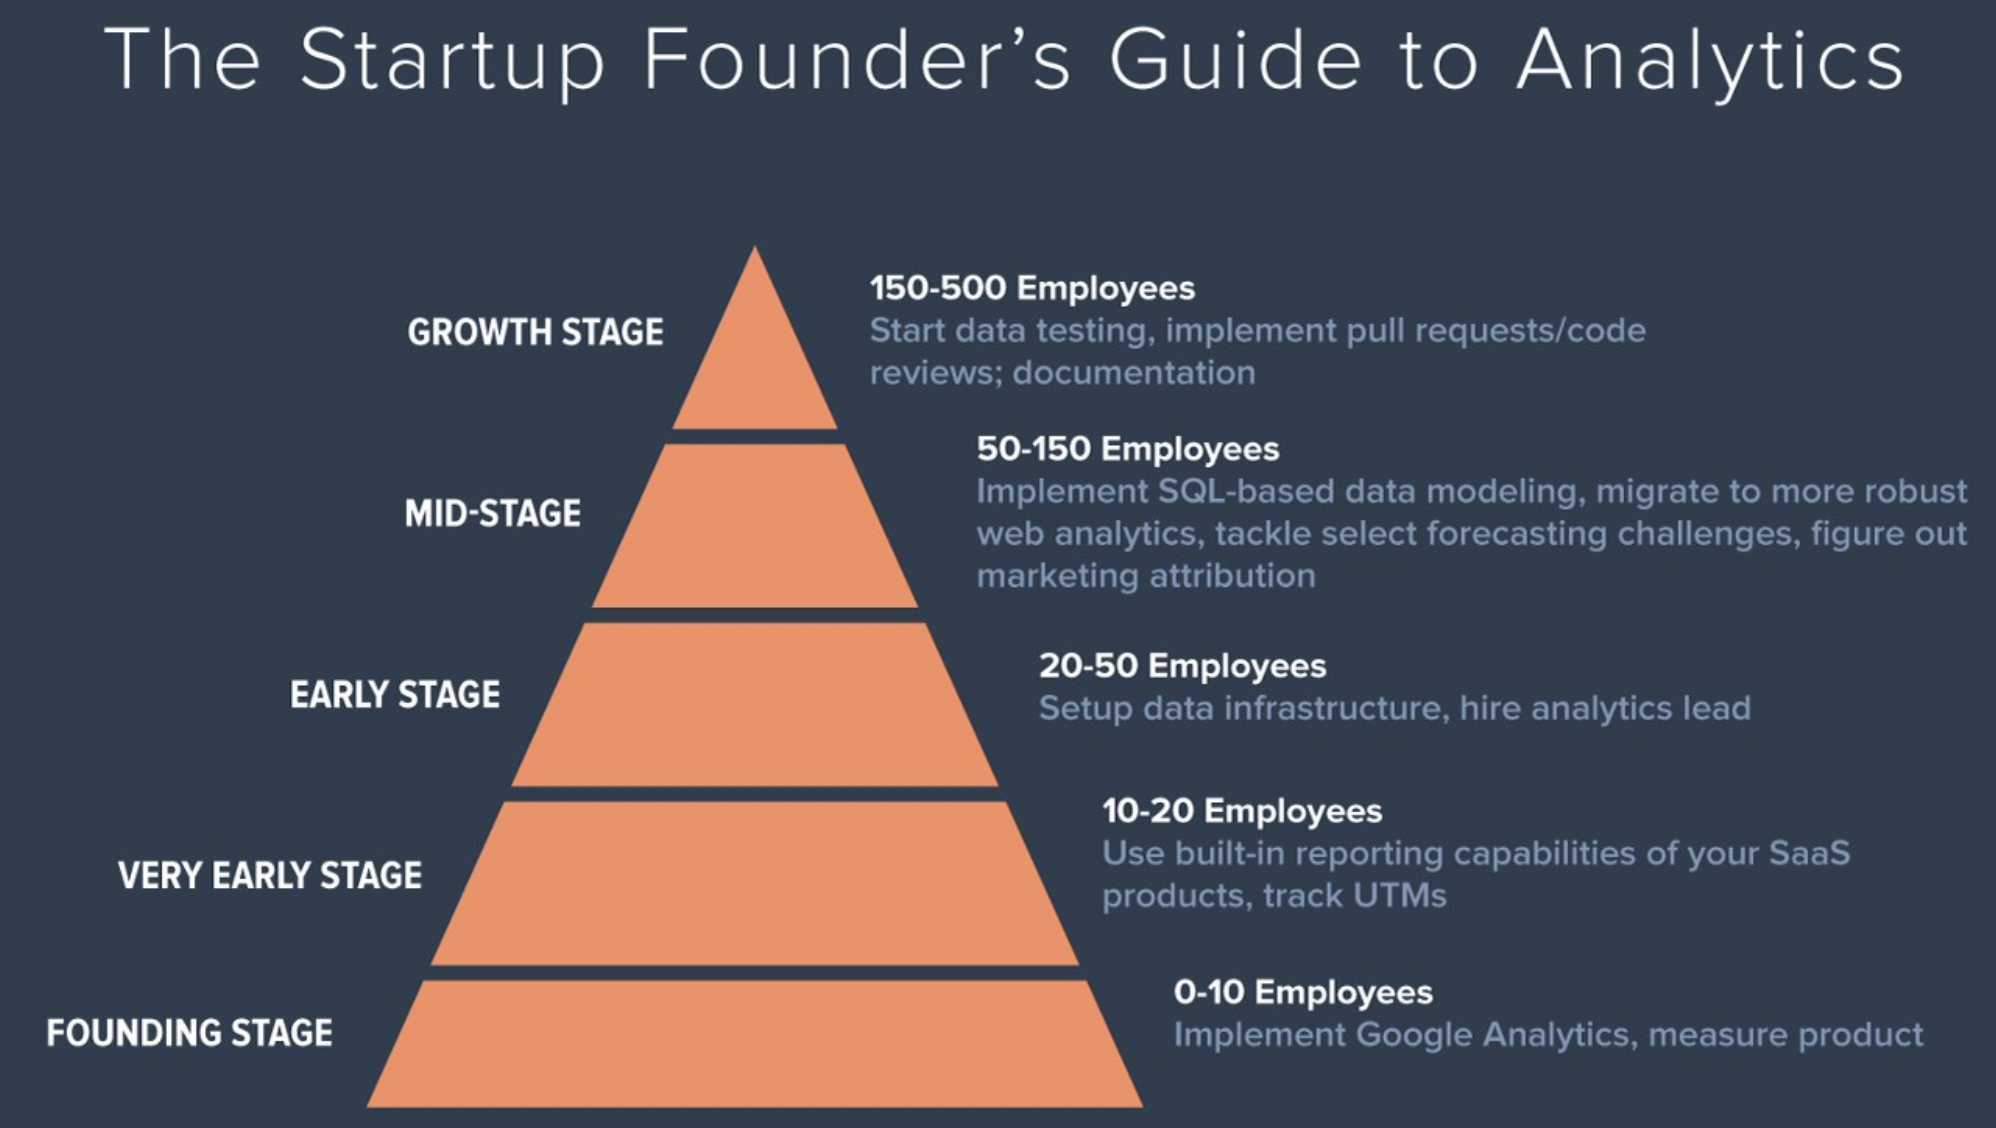
data analytics startups etapes

Source: thinkgrowth.org 

Your business starts dealing with data from day one. However, you don’t need a data analyst from those foundational days.

Data analysts command good salaries, and the limited resources you’ll have when starting your business should not go into hiring a data analyst. Also, this is the stage where you’ll be closest to your business, so you should be able to make good decisions based on your instincts.

Hiring a data analyst may also not be efficient even when your business has grown to 10 – 20 employees. You’re still not big enough to justify investing in building data infrastructure and hiring a data analyst. Instead, hire workers who can use the built-in reporting capabilities of your SaaS products.

When you’ve grown to 20 – 50 employees, you should bring a data analyst on board. With data coming from everywhere, you need a central team to make sense of them. First, you need to build your data infrastructure and then hire an analyst lead.

What to expect from your first data hire

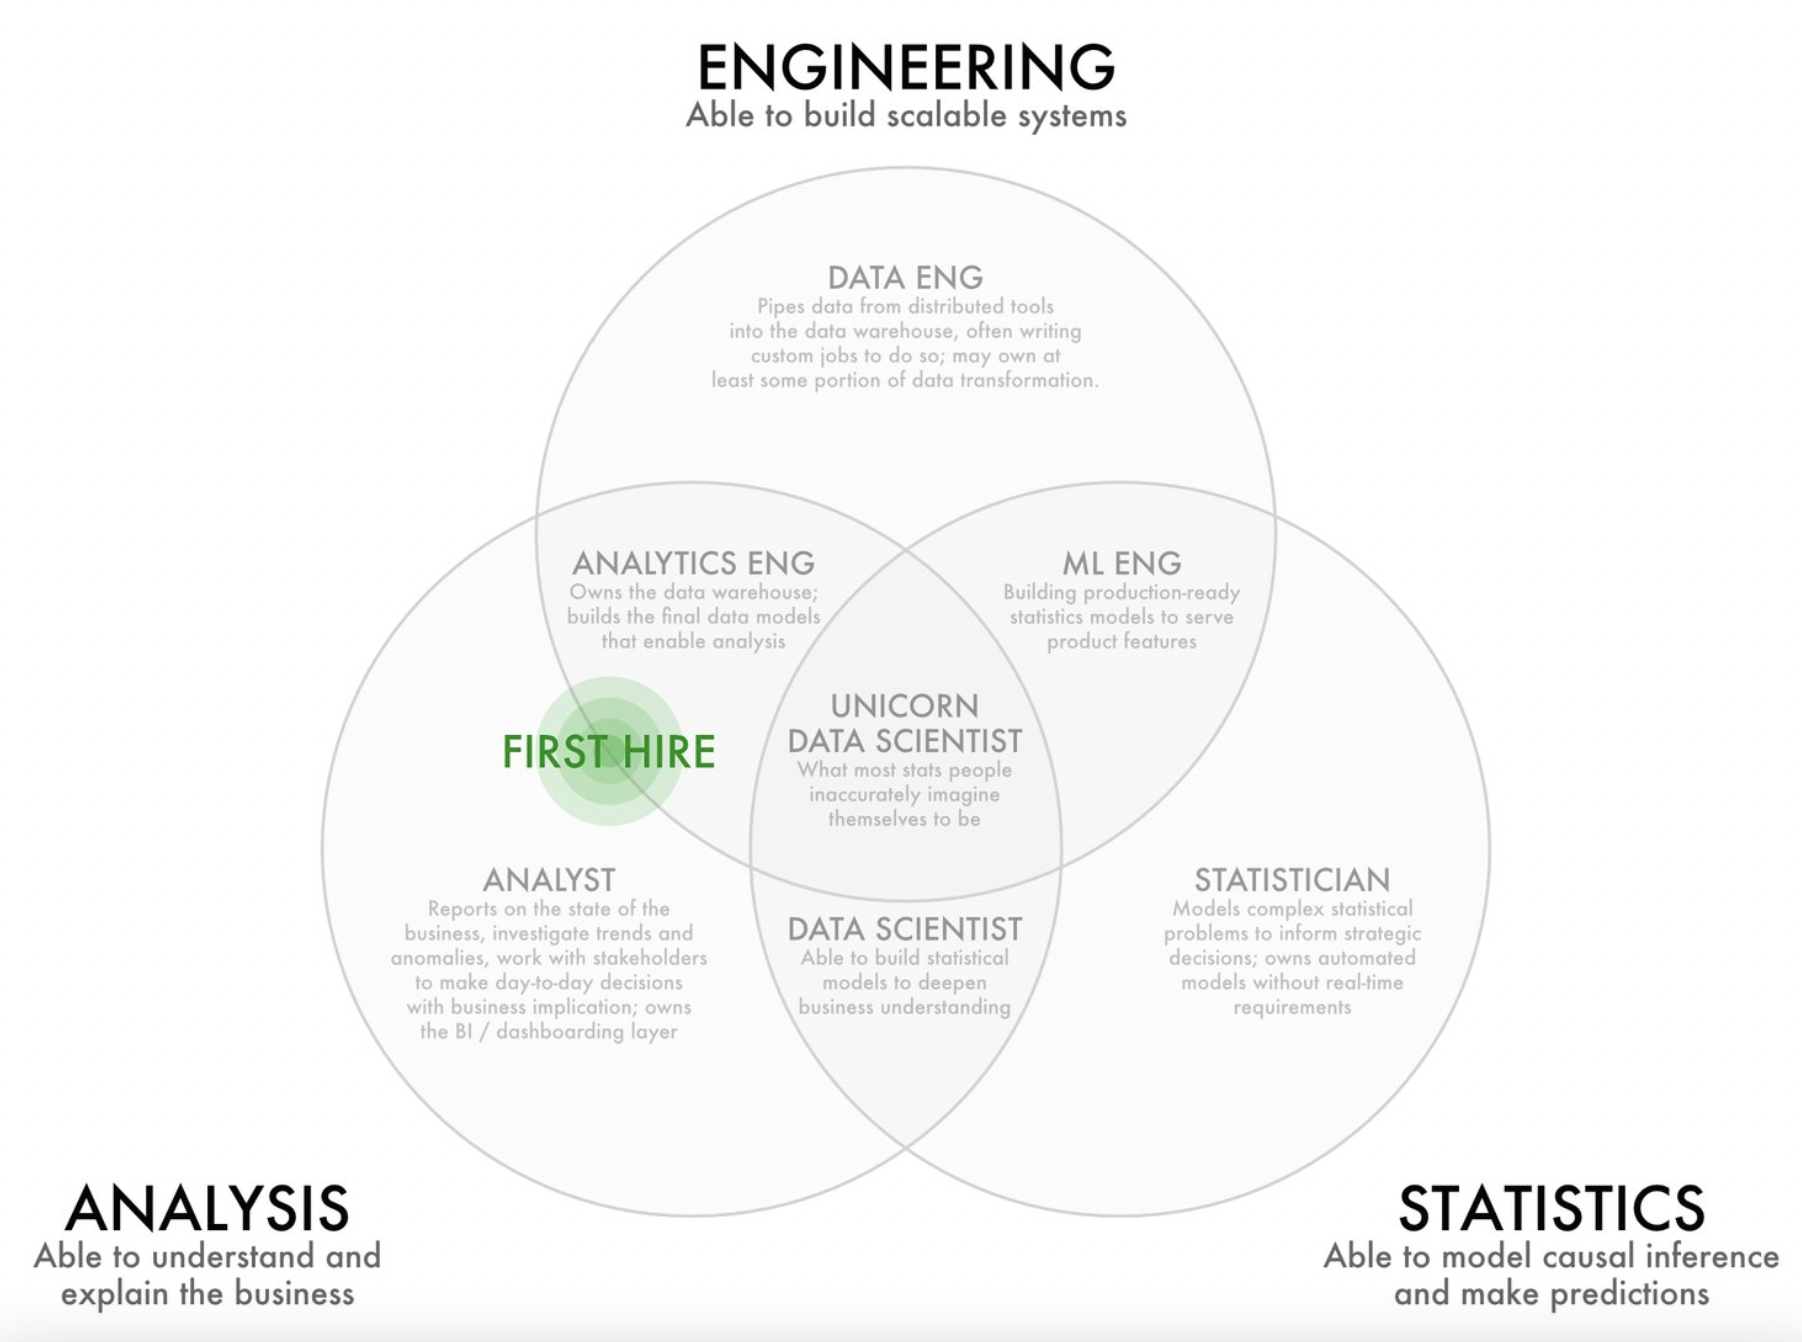
Your first data analyst hire should be someone who is a merger of a data analyst and analytics engineer.  

This is because when making your first hire, you’ll either not have a data infrastructure or will be in the process of building one. So, you need someone who’ll evaluate data to report on the state of business and build some of the foundations of the data warehouse.

What your first data analyst hire will do

Your first hire will do the following:

  • Data Analysis
    • Investigate trends
    • Do ad-hoc analysis
    • Build simple dashboards to display and analyze data 
    • Report on the state of the business
  • Analytics Engineering
    • Own the data warehouse
    • Develop data models that’ll be used for analysis 

data analytics startups data analyst vs data engineer vs data scientist

Source: abartholomew.com

What skills should your first data analyst hire have?

To effectively perform “analysis + analytics engineering” responsibilities, your first data analyst hire needs the following skills:

  • Business understanding. This is a no-brainer. The person needs to understand what the business is about, including its goals and KPIs. This is the only way to know what insights are valuable. 
  • Data modeling. Data modeling sets data standards for the organization. So, the person needs to know how to create data models that clearly show the organization’s relevant data elements and the connections between them. The person should be able to create visual representations of what data will be captured, how it will be stored, and how the individual data elements relate to the various business processes. 
  • Knowledge of SQL. Structured Query Language (SQL) is the standard querying language for all relational databases (like Oracle, Microsoft SQL, MySQL, etc.). To extract data from these databases, you need knowledge of SQL. Thus, SQL is a minimum requirement for data analysts.
  • Use of data ingestion tools. As a data analyst, you’ll need to transport data from different sources to a target site for evaluation and analysis. Data ingestion tools facilitate this by manually eliminating the need to code individual data pipelines for every data source. So, your first data analyst hire should be comfortable with using data ingestion tools or should be able to learn how to use them quickly.

How senior should your first data analyst hire be

As mentioned before, your first data analyst hire would perform analytics engineering responsibilities. Also, the person should be someone that will eventually lead your team of analytics professionals.

So, this should not be a starter analyst with minimal experience. Instead, they should be senior analysts with solid expertise in laying the foundations of a data warehouse and building and leading a data analytics team. 

Someone with that profile should have more than the minimum bachelor’s degree and have at least four years of experience.

Data Analyst hiring process decrypted

Attracting the right people is usually a challenge when you need to fill a position. It is even more challenging if the job is technical like that of a data analyst.

Below we decrypt the process and show you how to get the right data analyst. This will be discussed under three subheadings:

  • How to structure your analyst job description
  • What to do beyond the sharing the job offer
  • How to interview data analyst candidates

Structure your data analyst job description

Attracting strong data analyst candidates starts with posting a strong job description. Essential elements of a strong data analyst job description are:

  • Background of the role
  • Requirements for the role
  • Responsibilities of the role
  • Hiring Process
  • 30/ 60/ 90 day plan

1. Background/ Overview

In this part of the “job description,” briefly state your organization’s business and your goals for the role you are filling. The overview is what sells your organization to the candidates.

An excellent example of an overview is:

[Name of the company] is a company that specializes in the creation of multi-discipline business platforms with specialist partnerships for value co-creation in each of the different business segments through modern co-petition business principles.

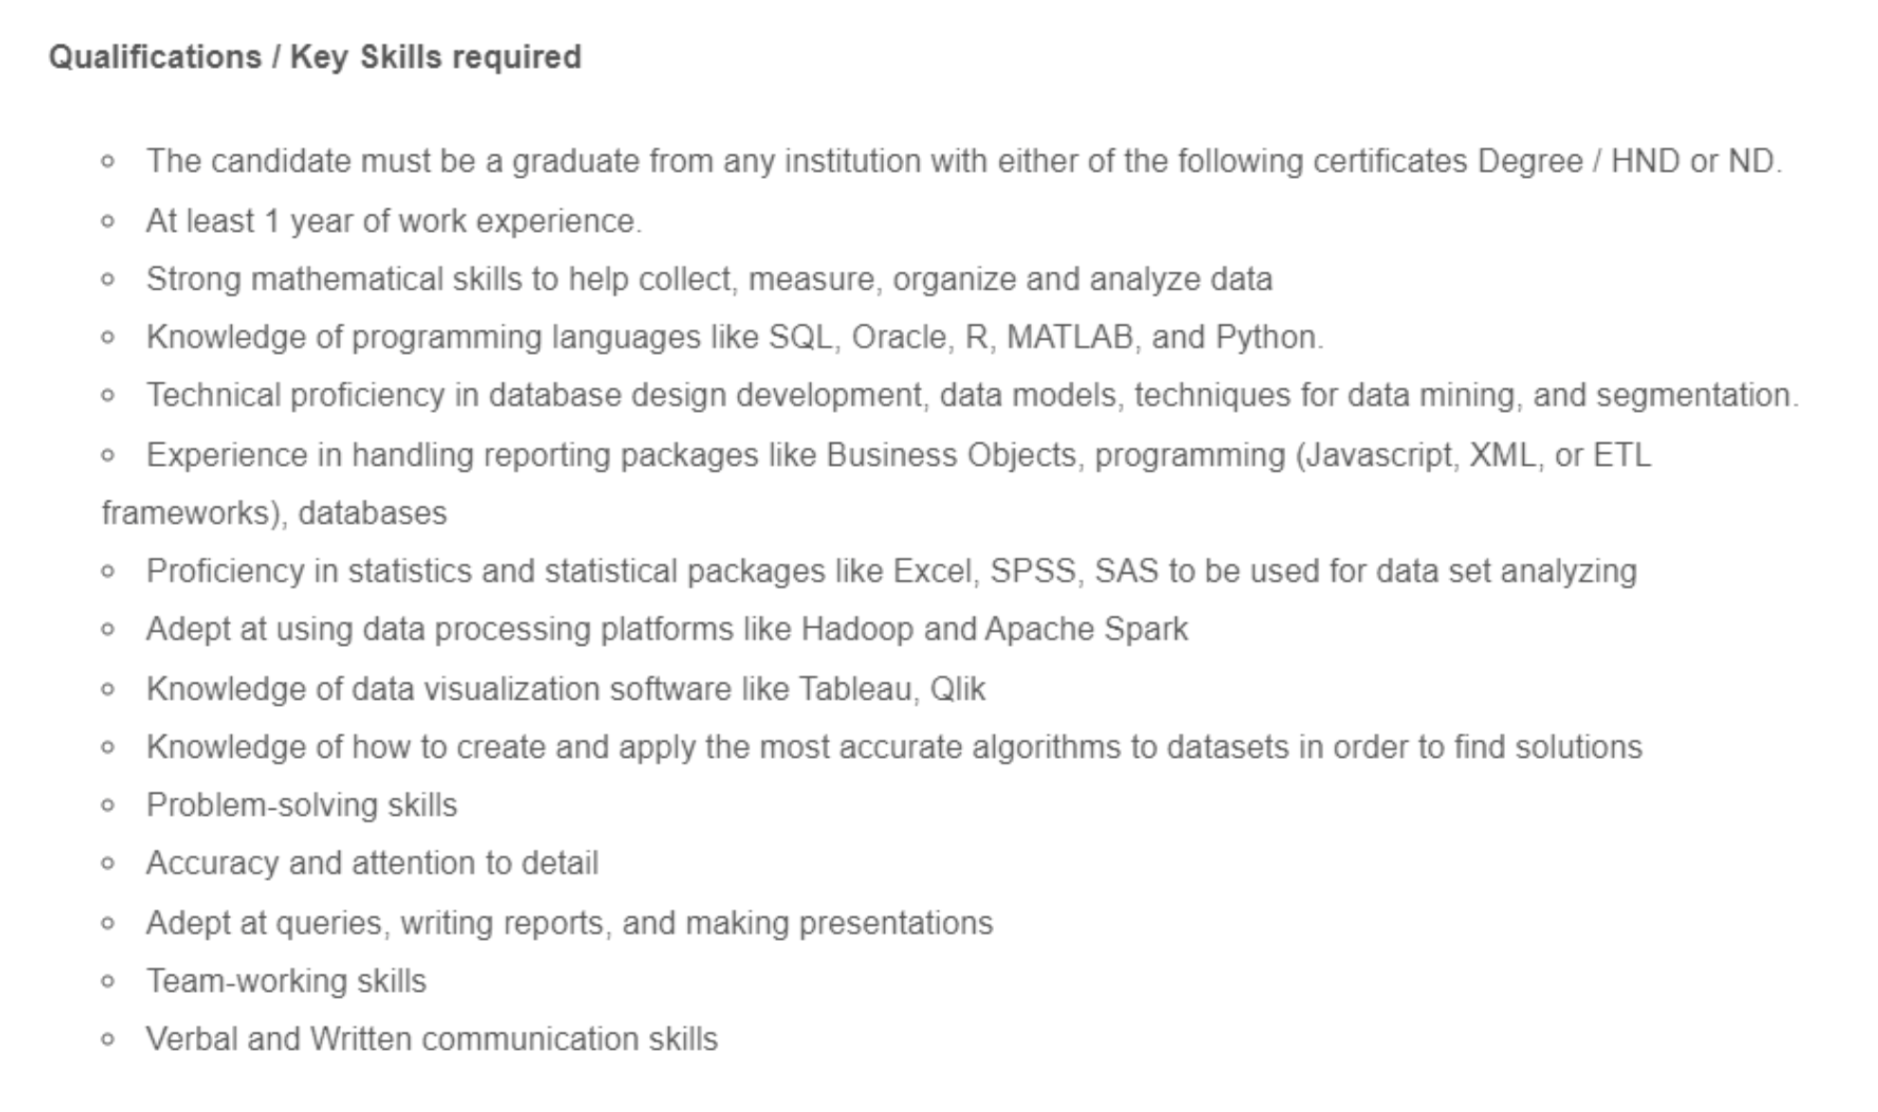
2. Requirements for the role

This is where you list the hard and soft skills you need in a candidate. It should include desired educational qualifications, certifications, and technical skills.

A good example is:

Requirements for the role sample

Source: Indeed

3. Responsibilities of the role

Here, state what you expect the data analyst to do in the role. While it is impossible to cover everything, you should be as specific as possible.

A good example is:

Responsibilities of the role sample

Source: Getdbt

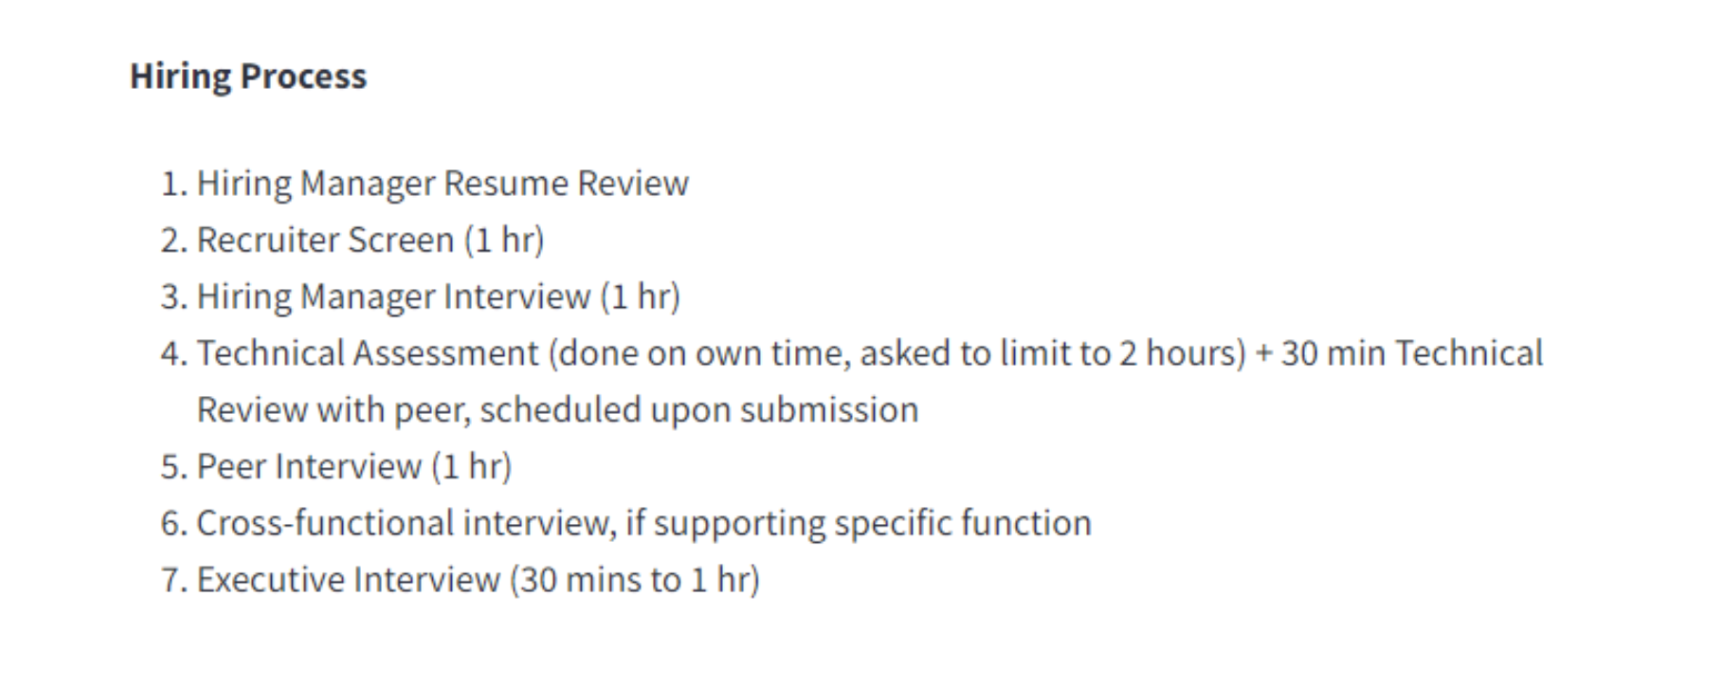
4. Hiring Process

Mention the different stages in your hiring process, from submitting applications to the interview (and beyond, if applicable). Mention what each step will involve and how long it’ll take. Candidates usually appreciate this because no one likes to be kept in the dark.

An example of this is:

Hiring process sample

Source: Getdbt

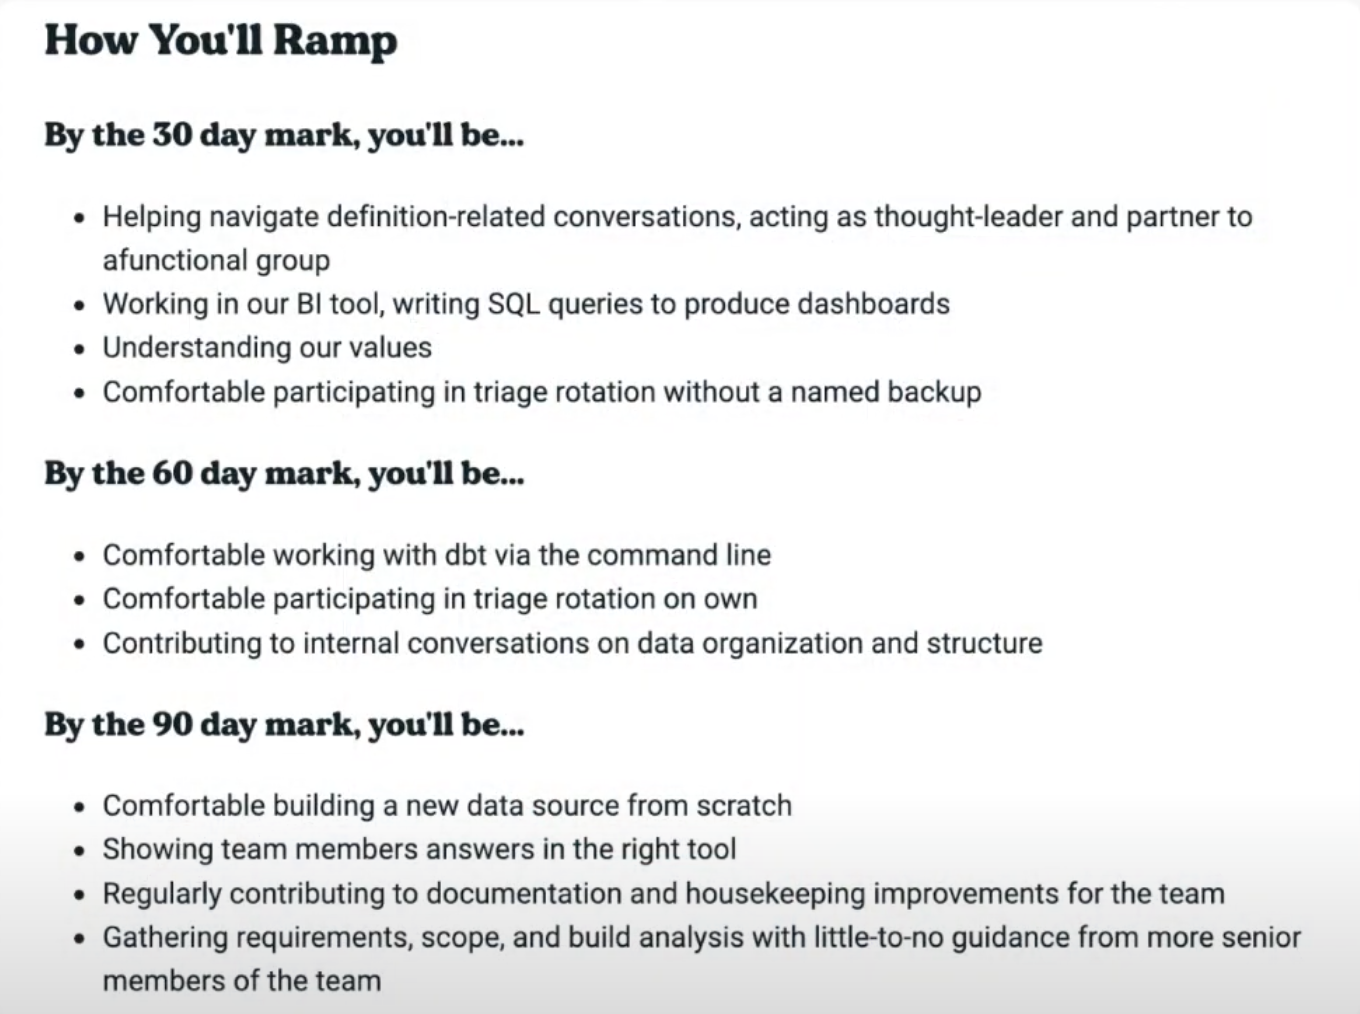
5. 30/ 60/ 90 day plan

This means clearly stating your expectations of the person in 30, 60, and 90 days on the job. It helps set standards for performance.

An example of this is:

Day plan sample

Source: Getdbt

Sharing the best job offer is not enough

While creating a great job offer is essential to attracting talents, even the best job offer does not guarantee to get the best talents.

This is because posted job offers are usually open to every Tom, Dick, and Harry. This is not that the Toms, Harrys, or Dicks will not make good analysts. It simply means that narrowing the search often produces better results.

Here are a few tips to go further in your research and find the best data analysts where they are 🙂

1. Visit data analysts’ communities

In the modern era, people with similar interests form communities to curate and share content. Interestingly, there are different data analyst communities. Simply reaching out to these communities can enliven your search.

Some popular online data analyst communities are:

  • Kaggle – a data science and machine learning community. 

Kaggle

Source: Kaggle

  • StackOverflow – a question and answer online platform for data scientists, system admins, mobile developers, game developers, and more.

StackOverflow

Source: Stackoverflow

Interestingly, data analyst communities are not only virtual. In addition to the online forums, they often hold offline meetups. Attending one of these seminars could get you “your man.”

2. Look at projects 

A good data analyst resume does not make one a good data analyst. The only way to tell that someone has the technical competencies mentioned in their resume is to evaluate projects that person has done.

Thankfully, you do not need to visit the person’s previous employer for this. There are many public resources that data analysts can use to showcase projects. An example is Kaggle.

There are different Kaggle competitions where analysts are tasked with solving data science problems. Host a Kaggle competition and see what the various data analysts do.

3. Look for storytellers

Storytelling means showing how insights from data relate to people and scenarios and galvanizing support for particular recommendations.

It is crucial because data analysts do not only munch numbers but they interpret data to inform decisions. Unfortunately, sometimes even the best facts do not sway people. Instead, you need to connect with people’s emotions to get their buy-in.

Conduct an interview for data analyst candidates

When conducting interviews for data analyst candidates, ask questions that reveal the person’s hard skills, behavioral skills, and soft skills.

1. Hard skills

Hard skills refer to the technical knowledge and abilities of the candidate. Relevant questions to reveal the technical abilities of data analysts candidates include:

What statistical tools and database software have you used previously, which do you prefer and why?

Why this matters:

Data analysts will apply statistical analysis to data. You need to know that they can do this.

What to listen for:

  • Knowledge of the main data language SQL
  • Use of other analysis software like SPSS
  • A willingness to learn new software

2. Behavioral skills

Behavioral questions show how the candidates handled situations in the past. An excellent example of a behavioral question to ask a data analyst candidate is: 

Describe a time when you designed an experiment. How did you measure success?

Why this matters:

Data analysts conduct experiments to determine whether an action will be successful, thereby saving their organizations from taking doomed steps. This question tells you if the candidate understands the concept of experiments.

What to look out for:

  • Outlining clear objectives of the experiment
  • Ability to design metrics and use these to measure results

3. Soft Skills

Soft skills refer to the candidate’s personality traits. An example of an excellent question to ask data analyst candidates to reveal personal traits is:

What do you think are three personality traits that data analysts should have, and why?

Why this matters:

Data analysts need more than technical abilities. In answering this question, candidates will often mention attributes that they possess. So, the question tells you more about the person. 

What to look out for:

  • Appreciating that certain personality traits are as crucial to a data analyst as technical skills
  • A mention of some of the most critical soft skills, like attention to detail. 

How to get the best of your first data analyst

Hiring the right data analyst is good, but it is even better if the person delivers well.

One way to do this is to set clear expectations using the 30/ 60/ 90 days plan. That is, clearly define what you expect the data analyst to be doing (or have done) after 30, 60, and 90 days on the job. Then review these with the data analyst periodically to determine how performance is stacking up.

30/ 60/ 90 days plan

Source: Getdbt

30 days expectations

Since the first 30 days is still “early days” for the data analyst in the organization, expectations should center around:

  • Familiarization with the company’s business and values 
  • Understanding reporting and insight needs
  • Extracting data from different sources and loading it into the data warehouse

60 days expectations

By the end of the second month in the role, the data analyst should have understood the business. So the analyst should have:

  • Have created dashboards covering important KPIs.
  • Be in the process of developing a data model.

90 days expectations

By the end of the third month, the data analyst should be very mature in the role. The analyst should:

  • Have completed the first version of the data model.
  • Be able to build a data source from scratch and easily build analysis.
  • Be able to answer questions for business users easily.

Wrapping up

You need a data analyst to make sense of your business data and give you insights that’ll help you make the right business decisions. Key takeaways from this detailed article about “how to hire a data analyst” are: 

  • You may not need an analyst until you have 20 – 50 employees and have data needs that justify building data infrastructure.
  • Your first data analyst hire should not be a junior analyst but a senior with expertise in building infrastructure and leading teams.
  • To attract strong data analysts, important elements to include in the job posting consist of the “hiring process” and “30/ 60/ 90 days” plan.
  • Posting a good job offer does not guarantee to get the right analyst. You need to narrow your search by visiting data analyst communities and evaluating projects.
  • In interviews for data analyst candidates, ask questions that reveal hard skills, soft skills, and behavioral elements.
  • After hiring, to get the best out of your data analyst, use the “30/ 60/ 90 days” plan to set clear expectations.

LTV – Definition, calculation, and use cases of Lifetime Value

There is a huge paradox around lifetime value: it is undoubtedly the essential business indicator, especially in e-commerce…but only a minority of businesses use it. 

According to an English study, only 34% of marketers say they know what lifetime value means. When you realize everything you can do with this indicator, it’s to die for. And it’s not just about measurement and reporting but, more importantly, about activation potential.

So, if you want to increase your income, you must calculate and use the lifetime value.

Let’s find out together what lifetime value is and, more importantly, how to use it intelligently to maximize your client assets.

What is Lifetime Value or LTV?

Definition

Lifetime value is a business indicator that estimates the amount of revenue generated by a customer over its entire lifetime.

This indicator lets you know how much a customer earns you throughout their relationship with your company, from their first purchase until the moment they end the relationship.

If a client generates an average of 50 euros in revenue per month and remains a customer for 3 years, their lifetime value will be 50 x 12 x 3 = 1,800 euros. The lifetime value is a monetary value, so it will be expressed in euros, for example.

Lifetime value is also called “customer lifetime value,” but more rarely. The acronym LTV (or CLTV) is very common.

A few clarifications should be made: 

  • The lifetime value is the sum of the average revenue (i.e., the margin) generated by a client throughout their life. BUT, sometimes turnover is used instead of income.
  • The lifetime value is an estimate. By definition, it is not possible to determine the lifetime value of Mr. Dupont before he has ended his relationship with your company. However, it is possible to estimate his lifetime value based on his profile, the data available to your IS, the lifetime value of the customer segment to which he belongs, etc.
  • The lifetime value can be calculated at several levels: at the global level (all your customers), at the level of a customer segment, or even at the level of each customer.

Lifetime Value is a key indicator in business sectors where controlling acquisition costs is crucial. This concerns in particular:

  • Subscription business models, SaaS businesses, for example. 
  • Retail and E-commerce.

Focus on 4 Lifetime Value use cases

Here are some typical LTV use cases. The list is far from being exhaustive.

Use case #1 – Determine the target customer acquisition cost (CAC)

Estimating how much a given customer will bring you in total allows you to assess the maximum marketing and sales investments to acquire that customer. The underlying idea is that it is absurd to spend more to acquire a customer than the revenue that customer will bring to the company.

If you know the client will earn you an average of $10,000; you can justify investing $3,000 to convert them. Marketing and sales efforts should always be commensurate with the revenue expected.

Along the same lines, you can use LTV to identify the break-even point, where the revenue generated exceeds the cost invested.

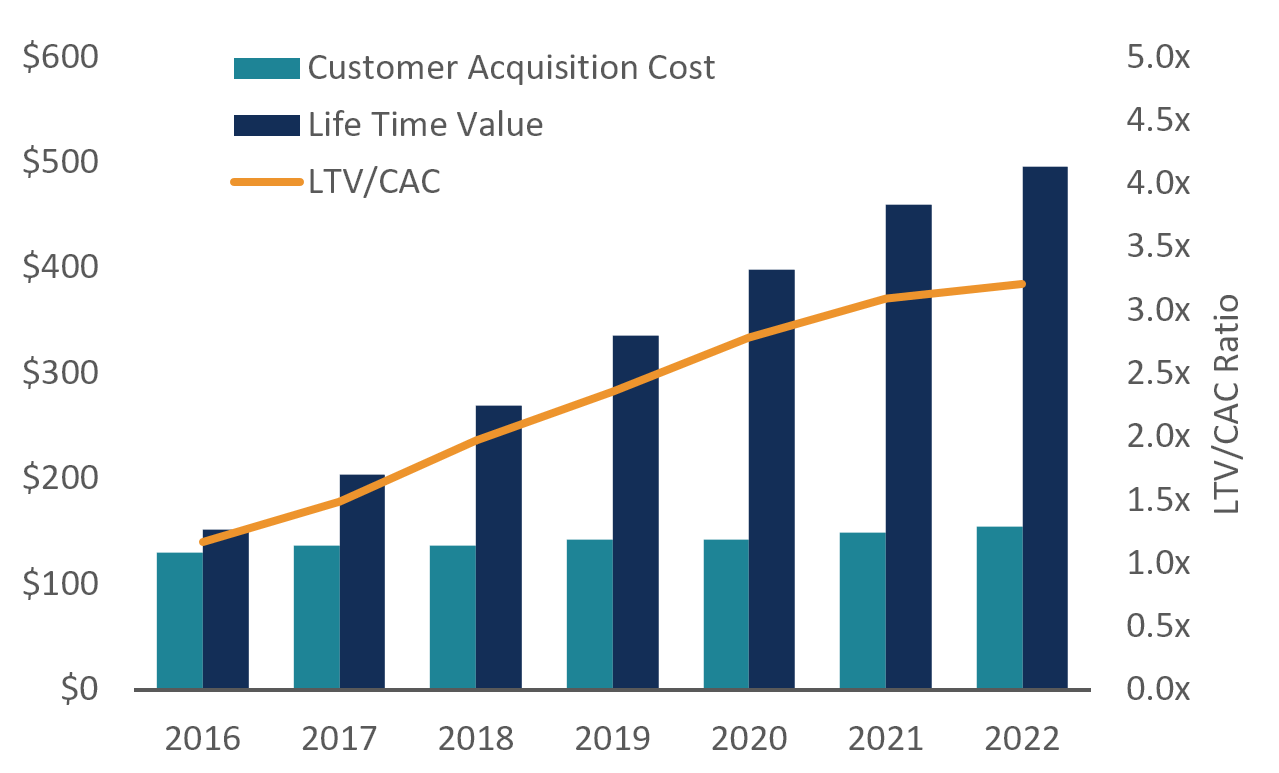
The LTV / CAC ratio is very important.

If the ratio is less than 1, the activity is not viable. When the ratio is greater than 3, it is an excellent sign, provided it is stable.

Ratio LTV CAC
Source: Ecommerce Finance Model Valuation

Use case #2 Target the most profitable customers first

We assume that you have already built a customer segmentation. If so, then LTV is one of the most relevant metrics to gauge the value of each segment. We strongly encourage you to calculate the LTV of your different segments. This way, you will identify your best segments. You can then imagine specific actions for these VIP customers, remembering to pamper them!

In this case, just as before, the Lifetime Value indicator appears to be an excellent tool for optimizing marketing efforts and investments.

The Lifetime Value allows you to assess who your best customers are!

Octolis

Use case #3 – Identify your weak points and areas for improvement

All the work required to calculate the Lifetime Value will help you identify weak points or at least areas for improvement in your business. The use of Lifetime Value induces a resolutely “customer-centric” way of thinking that can only enlighten you on many things! For this reason alone, and in the process of continuous improvement, calculating the Lifetime Value of your customers and your segments is worthwhile.

Use case #4 – Plan your annual advertising budget

This ties in with what we said above. If you know your LTV, you can more easily and more accurately determine the budget to invest in acquisition, advertising campaigns, etc.

How to calculate LTV?

Now that you know the definition of Lifetime Value and its possible uses, let’s see how you can calculate it.

Is there a single LTV calculation formula?

No, there are several formulas to calculate the Lifetime Value for two reasons:

  • We saw in the first part that the variable used to build this indicator could be the margin or the turnover. This leads to different calculation formulas.
  • The calculation formula also depends on the business model of the activity. This needs some explaining…

The formula for calculating LTV, in a way, will always be:

[What a customer earns me per month] X [Customer Lifetime].

But the calculation of the first variable of the formula ([What the customer earns me per month]) is directly linked to the business model of the activity. In an e-commerce activity, what a customer brings me is calculated by the formula Average shopping cart X Purchase Frequency. In a subscription business model, the calculation is more straightforward: it is the price of the subscription.

Is it easier to calculate LTV from margin or turnover?

Calculating Lifetime Value using turnover is much easier. The calculation of the LTV from the margin is more complex, but it is the only one to allow an estimation of the financial performance.

What is the formula for calculating LTV in E-commerce?

In e-commerce, the Lifetime Value formula is as follows:

LFT = (Average Shopping Cart + Frequency + Gross Margin) / Churn Rate

Each element of this formula is itself an indicator with a calculation formula.

Average Shopping Cart

This is the turnover divided by the number of orders. A company that generates a turnover of €1,000,000 and has 30,000 orders has an average shopping cart of: 1,000,000 / 30,000 = €33.

Purchase frequency

Purchase frequency is calculated by dividing the total number of orders by the number of (unique) customers. If you have 1,000 orders per year and 50 customers, the purchase frequency is 1,000 / 50 = 20.

Gross margin

Gross margin is turnover minus purchase costs, divided by the turnover then multiplied by 100 to obtain a percentage.

For example, if you buy a product for 50 euros and resell it for 100 euros:

Gross margin = (100 – 50) / 100 = 0.5. → 0.5 x 100 = 50%. You make 50% gross margin.

Churn rate

The churn rate, or attrition rate, calculates the loss of customers over a period of time. It is calculated as follows:

Churn rate = (Number of customers at the end of the period – Number of customers at the start of the period) / Number of customers at the start of the period.

Again, multiply the result by 100 to get a percentage.

Let’s take an example. You want to calculate the attrition rate between January 1 and February 1. You had 110 customers on January 1, and you have 80 on February 1. Your attrition rate is equal to: (80 – 110) / 110 = – 0.27.

How to improve the Lifetime Value in E-commerce? (4 practical tips)

Improving lifetime value should be one of the main objectives of any e-commerce business. How to achieve it? To answer this question, we must assess each of the terms of the equation. Improving lifetime value involves improving one or more of the variables of the calculation formula that we developed earlier. This means:

  • Improve the average shopping cart and/or
  • Increase the purchase frequency and/or
  • Increase the gross margin and/or
  • Decrease the churn.

Here are 4 tips to improve each of these variables without claiming to be exhaustive. These are a few avenues to explore…

1. Improving the average shopping cart

Improving the average shopping cart means customers should place higher orders. How? By encouraging them to add more products to their cart. How? By offering them, during the buying journey, complementary products. This is called cross-selling. Another option is to offer customers higher-end products. We then speak of up-selling, widely used in the world of services and retail.

Here are some ideas to consider:

  • Offer personalized products on the site, make product recommendations based on customer preferences. This implies, of course, that the visitor browsing the site is a known visitor.
  • Send personalized email campaigns offering product recommendations based on purchase history and/or other information about your customers (purchase preferences, socio-demographic information, etc.).
  • Highlight complementary or similar products during the buying journey, depending on the products added to the cart.
  • Create product packs.
  • Offer delivery beyond a certain purchase amount.
  • Create a loyalty program to incentivize customers to buy more to earn points/rewards.

2. Improve the purchase frequency

You may have customers who buy a lot, have a large average shopping cart, and buy infrequently…or less often than you would like. There are different techniques to encourage customers to buy more often and thus increase their purchase frequency. But they essentially boil down to one thing: creating email or mobile campaigns and scenarios (and even postal direct marketing, if you use this channel). We think of promotional campaigns or abandoned cart relaunch scenarios (the abandoned cart relaunch is a great way to increase lifetime value!).

We are entering here into the mysteries of relationship marketing, into the relationship plan… By communicating regularly and relevantly with your customers and maintaining a customer relationship with them outside of purchasing times, you will be able to make them more loyal customers who purchase more. The subject is vast. We invite you to discover the complete guide to the relationship marketing plan published by our friends at Cartelis.

3. Improve gross margin

To increase gross margin, you have two levers:

  • Increase prices.
  • Reduce product purchasing costs.

Here are two ways to increase the gross margin:

  • Use an inventory manager to estimate your restocking needs correctly and limit inventory to what is necessary while avoiding the out-of-stock risk (fatal in the e-commerce sector, where customers want to have everything right away).
  • Market high-margin products. It’s simple and logical! The margin rate varies enormously from one product to another. You must identify and market products with a high margin rate while remaining in your universe. You can also highlight in your communications the products with the highest margin rate (see the product recommendations we were talking about above).

4. Reduce the churn rate

The churn rate is a very complex metric. There are many reasons and factors that can lead a customer to stop buying from you. There are no secrets to reducing churn: you need to increase customer retention, customer loyalty. This involves:

  • The implementation of a concrete relational plan,
  • A constantly renewed understanding of the needs of your target, to constantly adjust your offers in line with customer expectations,
  • The improvement of the customer experience at all stages of the customer journey: improvement of the website, optimization of customer service, improvement of the services offered to the customer…

How to calculate the Lifetime Value using a Customer Data Platform?

Calculating and monitoring the Lifetime Value requires having aggregated, consolidated, unified data. The calculation formula presented above clearly highlights this need: you should have a clear knowledge of the average shopping cart, purchase frequency, gross margin, customer status, customer preferences, etc. But this knowledge is not enough; it still has to be unified, brought together in the same system. For this reason, our last advice is to invest in a solution for the unification of customer, transactional and financial data…

It is impossible to reasonably implement a strategy based on Lifetime Value without having a Unique Customer data Repository. Customer Data Platforms represent the modern solution for consolidating and unifying customer data (in the broad sense of the term, including transactional data, etc.).

With this type of solution, you can efficiently (and easily) calculate the lifetime value and use it to segment and personalize your relational marketing. Why “easily?” Because with a CDP, you have all the variables of the lifetime value formula in one place. Lifetime values ​​can be calculated automatically in the CDP once you have collected all the necessary data.

In short: with a CDP, you can connect all your data, calculate the Lifetime Value, and send the calculated segments/aggregates to your activation tools to better communicate with your customers…and increase their Lifetime Value.

Octolis offers a modern CDP solution to truly leverage your customer base
We’ve published a comprehensive guide to Customer Data Platforms if you want to learn more.

Conclusion

In e-commerce, there are many opportunities to maximize revenue. Client assets are generally underutilized. The Lifetime Value is one of the best indicator to help you increase the income of an e-commerce activity while remaining resolutely customer-centric. We have seen what it is, how to calculate it, why to use it, and how to improve it. Now, it’s up to you!

9 customer segmentation examples and methods

Customer segmentation is a very powerful tool, but the reality is that few marketers use it properly.
It’s not enough to play with a few filters in Mailchimp or Salesforce. Customer segmentation is a complex process that requires a clear vision of the marketing objectives, the key personalization axes, the methodology for monitoring segmentation incremental impacts, etc.

First and foremost, you need to understand the state of the art.
Unless you work in a large company, or a very mature scaleup, the first step is to know the subject’s best practices and adapt them to your business.
We have prepared a complete article on customer segmentation, including 9 examples of classic customer segmentation to inspire you.

What makes a good customer segment?

A good segmentation should include these 6 characteristics:

  1. Relevant: it’s usually not profitable to target small segments – so a segment should be large enough to be potentially profitable.
  2. Measurable: Know how to identify customers in each segment, keep control of customer data,  and measure their characteristics such as demographics or consumer behavior.
  3. Accessible:  It sounds obvious, but your business should be able to reach these segments through different communication and distribution channels. For example, if your business targets young people, it should have Twitter and Tumblr accounts. You should also know how to use them to promote your products or services.
  4. Stable: To maximize the impact of your campaigns, each segment must be stable enough for an extended period. For example, the standard of living is often used as a means of segmentation, but this is dynamic and constantly changing. Therefore, it is not necessarily wise to make a segmentation based on this variable at the global level.
  5. Differentiable: People (or organizations in B2B marketing) in one segment should have similar needs, and these would be different from those of people in other segments.
  6. Actionable: This implies being able to deliver products or services to your segments. An American insurance company spent a lot of time and money identifying a segment and then realized it couldn’t find any customers for its insurance product in this segment. And it wasn’t able to devise a strategy to target them either.

The classic dimensions of customer segmentation

GeographyDemographic (B2C)Demographic (B2B)PsychographicBehavioral
ContinentAgeSectorSocial classUsage
CountrySexNumber of employeesLiving standardsLoyalty
StateAnnual revenueDigital maturityValuesSensitivity to XYZ
RegionSocio-professional CategoryFinancial situationPersonalityPurchase frequency
DepartmentMarital statusShareholdingConvictionsPayment method
CityStudy levelMarket capitalizationSocial networksConsumption habits
VilleJob TitleBusiness modelHobbies
DistrictLanguageTechnologies used
ClimateReligion

Customer segmentation is divided into 4 main categories:

  • Geographic segmentation: It groups customers according to their location. Where they live, work, or go on vacation, for example.
  • Demographic Segmentation: It groups customers using characteristics such as age, gender, income, or industry.
  • Psychographic Segmentation: It groups customers according to their psychological characteristics, such as their interests, opinions, or social status.
  • Behavioral Segmentation: It groups customers based on their buying behavior or customer journey stage. Customers who spend a lot, those who buy at a discount, or those who are at risk of changing their minds, for example.

9 exemples actionnables de segmentation client

1. SML segments (Small, Medium, and Large)

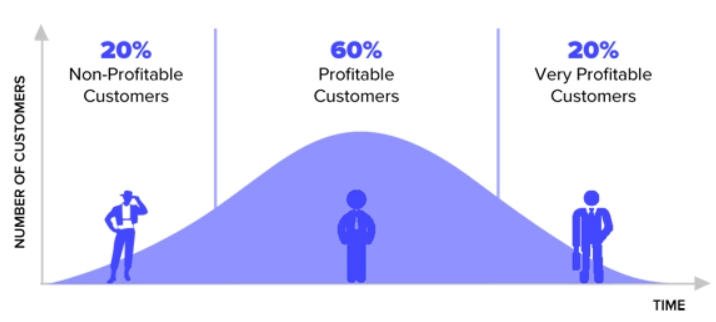
SML segmentation is based on Pareto’s law, which states that 20% of your customers generate 80% of your turnover. Therefore, you should primarily focus your efforts on this minority of customers.

This segmentation divides customers into three segments:

  • Large customers: who represent a small part of customers but a high percentage of turnover.
  • Average customers: who are few and represent a significant share of turnover.
  • Small customers: the mass that represents only a moderate, even small part of your turnover.

Once these three segments have been determined, it is necessary to identify their commonalities and understand their expectations to fulfill them in a specific way. Your marketing strategy (message, communications frequency, promotional offers, etc.) will differ based on whether you are targeting small or large customers.

The more customers represent a significant part of your turnover, the more you will personalize your communication to offer them an exceptional customer experience using marketing automation software.

2. Promophilia

Promophilia designates the category of buyers responsive to promotions. The search for the right deal is their primary motivation. These are the famous “coupon lovers.”

This is a behavioral segmentation criterion. They spend a lot of time surfing the web to find the cheapest product. If you want to prioritize this type of consumer, you should set up loyalty programs.

The objective is to define segments based on responsiveness to promotional campaigns. For example, those who bought your product with a coupon in the last X days.

3. Stages in the customer journey

Customer journey phaseSegmentDefinition
ConversionPotential customersContacts who have not yet made a purchase but have shown interest in one of your acquisition campaigns.
GrowthFirst-time buyersCustomers who have only bought once and who need to be turned into repeat buyers.
LoyaltyRepeat customersCustomers who have made at least two separate purchases over time.
RetentionLoyal customersCustomers who have purchased multiple times in a short period of time.
Re-conquestRepeat customers at riskCustomers who have purchased several times but have not purchased anything for a long time.
AttritionInactive repeat customersThe loyal customers you have lost.

You can thus create 6 different customer segments:

  • Potential customers (prospects): these are contacts who have not yet made a purchase but have shown interest in one of your acquisition campaigns. You have to bring them to a first conversion with retargeting campaigns, coupons to play on FOMO to accelerate conversion, educational content to convince, etc.
  • First-time buyers (the new “real” customers): these are customers who have only bought once and who need to be transformed into repeat buyers. You have to remind them of your existence via product recommendations, educational content, or a request for an opinion on the first product purchased.
  • Customers who have purchased at least twice (repeat customers): these are buyers who have made at least two separate purchases over time. You have to nurture a dialogue to keep them and make them your ambassadors. Encourage those customers to make new purchases with offers on new products, a reorder form or even exclusive coupons.
  • Loyal customers (your best customers): these are the customers who have purchased several times in a short period. Your ambassadors have demonstrated their attachment to your brand and its products. To maintain their loyalty, involve them in your product innovation process. You can give them early access to your new offers or send them requests for customer reviews.
  • At-risk repeat customers: these are customers who have purchased several times but have not purchased anything for a long time. Recover them by sending them positive messages about your products, a coupon with a limited period of use, or even a questionnaire with an incentive.
  • Inactive repeat customers: these are the loyal customers you have lost. You should reactivate the relationship and renew the dialogue by sending large product promotions or a questionnaire like: “How can I help you?”.

Source: Dolist

4. Customer satisfaction and NPS

The Net Promoter Score (NPS) is the indicator of customer satisfaction and loyalty. It measures the likelihood that your customers will recommend your brand, products, or services. According to the score given by the customer, the latter is classified into one of the following 3 categories:

  • Promoters (score of 9 or 10)
  • Passives (7 or 8)
  • Detractors (0 to 6)

The NPS segmentation induces homogeneity between each segment of customers, but this is not always the case. Not all detractors are equal. A detractor of 0 may not necessarily ruin your reputation, but they may be likelier to complain about your business than the customer who gave you a 6 rating.

This also applies to your promoters and passives. Not all of your promoters are promoting, and some passives may not be so passive after all. A study revealed that customers who give ratings of 8, 9, or 10 were all similar in terms of recommendation probability.

So focus on passives who give you an 8 rating to boost customer recommendations. On the other hand, there is a significant difference between a rating of 7 and 8, or between 6 and 7 in terms of recommendation probability.

You can develop different strategies for detractors who have given you a rating of 6 to convert them into promoters. Pay attention to satisfying your passives to give them the little nudge necessary to become promoters. Use NPS to boost customer recommendations.

5. RFM Segments (Recency, Frequency, Monetary value)

RFM segmentation is one of the most popular customer scoring systems based on previous purchases. Direct marketers use it to score each customer and predict each segment’s reaction to future marketing campaigns.

From the RFM analysis, we can draw 6 segments:

Customer segmentRFMDescriptionMarketing action
The hardcore - Your best customers111Highly engaged customers who have purchased your products recently, most often, and generated the most revenue.Focus on loyalty programs and new product launches. These customers have proven they are willing to pay more, so don't offer discounts to generate additional sales. Instead, focus on high value actions by recommending products based on their previous purchases.
The loyal - Your most loyal customersX1XCustomers who buy most often from your store.Loyalty programs are effective for these repeat visitors. Engagement programs and evaluations are also common strategies. Finally, consider rewarding these customers with free shipping or other such perks.
The whales - Your highest paying customersXX1Customers who generated the most revenue for your store.These customers demonstrated a strong willingness to pay. Consider premium offers, subscription levels, luxury products, or value-added cross-selling or upselling to increase total added value. Don't lose your margin with discounts.
The Promising - Loyal customersX13, X14Customers who come back often, but don't spend a lot.You have already succeeded in creating loyalty. Focus on increasing monetization through product recommendations based on past purchases and incentives tied to spend thresholds (set based on your store's average added value).
The recruits - Your newest customers14XNew buyers visiting your site for the first time.Most customers never become loyal. Having clear strategies for new buyers, such as welcome emails, will pay off.
The unfaithful - Once faithful but now gone44XGreat old customers who haven't bought in a long time.Customers leave for a variety of reasons. Depending on your situation, suggest price offers, new product launches, or other loyalty strategies.

6. Customer (in)activity

At a minimum, most companies classify customers into two categories: active customers and inactive customers. These categories indicate when a customer last made a purchase or engaged with you for the last time. For non-luxury products, active customers are those who have purchased in the last 12 months (and vice versa for inactive customers).

To segment the customer base according to the level of activity or commitment, we sometimes use a Recency Frequency Engagement scoring, like an RFM. Here, transactions are replaced by all forms of contact points (pages visited, email opening, email click, ..). We associate several points, for example, +1 email opening, +3 website visit, +5 email click, etc.

7. Purchase frequency

Active customers are your loyal customer base and brand ambassadors. They are more likely to share your posts, encourage others to buy your products, and leave comments.

Target these loyal customers with exclusive discount codes or a loyalty program to ensure your organic growth and multiply your organic reach online.

Loyalty programs are a great way to improve purchase frequency, as they effectively draw customers away from the competition by focusing their attention on your offers. By distributing loyalty points to customers, you motivate them to increase purchase frequency.

8. Customer value

This can lead to or be based in part on the RFM segmentation program.

The value of a customer is strictly determined by their cumulative spending. An LTV (Life Time Value) scale can be used to determine eligibility for offers, loyalty rewards, promotions, and other unique campaigns.

Building a customer score by giving a high or low value to each segment can help understand how high-value customers find you in general. Therefore, you can know how to direct your acquisition strategies.

9. Acquisition sources

In their buying journey, potential customers are likely to interact with your company through multiple acquisition channels, especially when developing an omnichannel customer relationship.

Analyzing these results allows you to be strategic and invest where it pays off. In addition, the source of acquisition can be very structured in explaining customer behavior thereafter.

We can even go so far as to segment by acquisition cohort to observe the behaviors induced by certain campaigns in the medium term.

Referred customers are 4x more likely to refer others to your brand. Segmenting your audience based on whether they were recommended or not is an effective approach to improving your referral sales.

Target your current customers who have joined your referral program and develop campaigns to turn them into super fans.

From segmentation to personalization

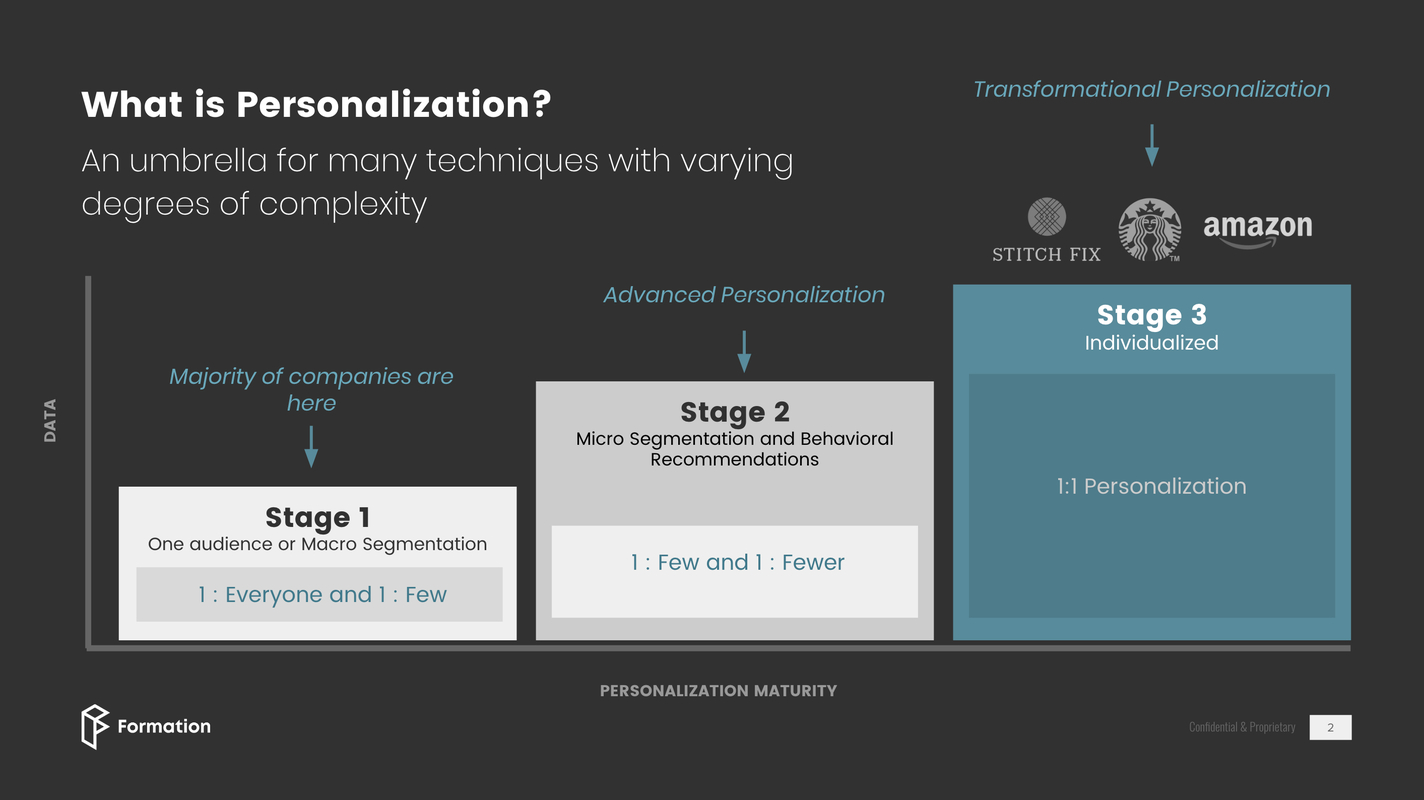
Source: Formation

Segmentation is a solid foundation, but it doesn’t offer everything you need to develop personalized offers and build strong relationships with your current customers.

Segmentation is an excellent working basis for customer data, but it only offers a general view of the customer. You should personalize your loyalty offers or messages even further. It will help you target and tailor messages and offers to different customers based on their unique wants, motivations, and needs.

This is why segmentation is often referred to as stage 1. Personalization (into 1-10 segments) and micro-segmentation (10-30 segments) as stage 2.

Many brands get stuck at these basic stages and thus limit their ability to develop deeper and more profitable relationships with their customers. To move to step 3, you have to go beyond segmentation’s limits to find the best alternatives.

Marketing teams must leverage artificial intelligence (AI) and machine learning (ML) algorithms to achieve true personalization. These advanced technologies help to continuously capture and analyze every interaction a customer has with your brand. With these analytics, businesses can individualize offers and messages to specific customers at scale.

For example, Starbucks, which has more than 30,000 stores and nearly 19 million active members of its rewards program, aims to be the most personalized brand globally. The company currently uses AI to continuously learn its customers’ preferences and desires based on purchases and interactions.

AI and machine learning capabilities have enabled Starbucks to create individualized loyalty offers at scale. The results have been phenomenal: 10x the speed of marketing execution and three times the one-to-one marketing and sales drive.

Therefore, segmentation alone is far from providing the value of true personalization and information with the same level of sophistication or detail. Nor can it deliver targeted, personalized messages to a huge volume of unique customers.

Why is it important to keep control of customer data?

Are you sure you have control over your customer data? If you’re reading these lines, a doubt probably assails you. And you’re right to doubt it because you may not be in control of your data.

Suppose your customers’ data are stored in your software (CRM, CDP, Marketing Automation). In that case, you don’t have full access to data, and you’re not free to manage security and confidentiality rules finely. You’re a prisoner of data models proposed (imposed) by editors. You’re locked into their ecosystem. 

Rest assured, you’re not alone in this case. Most organizations agree to store their data in their SaaS applications.

It’s time for things to change and for you to take back control of your customer data.

How to do it? This is the subject of this article.

The 3 key dimensions of data control

What does it actually mean to have control over your data? Having control over your data means:

  1. Full access to your data.
  2. Ability to manage data security (rights & permissions).
  3. Data privacy management.

Let’s go back in detail on each of these points, based on examples of tools: Google Analytics, Snowflake, and Amazon S3.

CritèresGoogle AnalyticsSnowflakeAWS S3Data center 'in-house'
Accessibilité des données🔒🔒🔒🔒🔒🔒🔒🔒🔒
Sécurité des données🔒🔒🔒🔒🔒🔒🔒🔒
Contrôle de la confidentialité🔒🔒🔒🔒🔒🔒🔒🔒

#1 Data accessibility (Level of data openness)

The first dimension of data control is the level of access to your data. It changes according to the tools and systems used. If we take examples like Google Analytics, Snowflake, and AWS 3, there’s one thing in common. In all three cases, the data are hosted in the cloud, but the level of data accessibility is not identical at all.

Data stored in Google Analytics are only accessible through dashboards and reports that Google gives you access. There’s no way to access the underlying data used to build the dashboards. You cannot make an SQL query on the Google Analytics database. So clearly, the level of access to data on Google Analytics is very low. You don’t have control of your data!

In a cloud infrastructure like Snowflake, you can interact with your data through complex SQL queries, taking advantage of all the computing power offered by a modern DWH Cloud. However, you cannot run Spark jobs.

This would be technically possible but very expensive in practice. On the other hand, it is feasible with Amazon S3, which, therefore, is the solution that offers the best level of access to data. Not only can you connect S3 to your BI tools and run SQL queries, but you can extract data and load it into Spark or your other applications.

The data access issue also encompasses data portability, i.e., the ability to extract data from one tool and host it in another database and tool. 

In terms of portability, Amazon S3 wins the prize. For example, you can easily switch your data from Amazon S3 to Google Cloud. Conversely, you cannot extract data from Google Analytics to other systems in its raw state.

#2 Data security (management and control of access & permissions)

The second dimension of data control is security. The level of data security is measured by your ability to manage access to your data. If you manage everything, then the level of data security is at the top. If you choose a cloud solution, be it Google Analytics and cloud infrastructure like Amazon S3, you don’t have complete control over data security. You’re limited by the access & rights management features offered by the solution.

On Google Analytics, you can manage user-based access, but you cannot set up attribute-based access control, as is the case with Amazon S3. If you store your data on your machines, you can create 100% tailor-made rights and permissions management mechanisms. 

The level of control over data security will always be lower with a SaaS/Cloud solution than with a self-hosted solution. The more sensitive the data you store, the more important it is to be well informed about the policies applied by cloud publishers.

Security management needs are not the same for all companies. A company with a small customer base and collects little data about its customers will typically have less trouble hosting its data in a cloud infrastructure like Snowflake or Amazon S3 than a big bank that stores large volumes of highly sensitive data.

#3 Privacy management

Privacy management is the third dimension of data control.

Data security, which we talked about above, is about who has access to your data. Data confidentiality is about the use of the data and whether it’s legal and approved by the user.

Let’s take our 3 examples to illustrate this dimension: Google Analytics, Snowflake, and Amazon S3. In these three companies, certain employees have access to your raw data. What they do or can do with your data, however, isn’t the same:

  • Google Analytics. There are Google employees with access to the reports you configured in Analytics. Google likely uses “your” Google Analytics data to create a user profile for marketing purposes. Even if what Google does with your visitor/customer data is unclear, there is no doubt that they use it.
  • Snowflake and AWS3. It appears likely that employees within these companies have more or less limited access to your raw data, but their analytical capabilities are more limited. They should be able to do reverse engineering to use your data. They can’t link customer data together and create a user profile as Google can. In addition, note that, in S3, you can encrypt your data.

When it comes to privacy, the focus is clearly on cloud infrastructure solutions like Snowflake or AWS 3.

Lack of data control = risk

The coupling data <> applications, a legacy of CRM/CDP publishers

Customer data is used by CRM solutions, Marketing Automation software, and other Customer Data Platforms. They are the fuel. What characterizes these programs is the coupling data <> applications. Clearly, your data is stored in applications, in your software. There’s no separation between the data layer and the software layer.

That’s how CRM and CDP editors traditionally operate. Data is collected, stored, and activated by and within the software. The CRM, or the CDP, is both a database (with restricted access to data) and an activation tool. 

The development of the SaaS model in CRM has not changed much in this situation: coupling remains the rule. Traditional or SaaS, same fight. The same goes for the Customer Data Platforms discussed so much for a few years.

Salesforce’s “anti-software” campaign was in its infancy, before becoming the symbol of these closed ecosystems

Why is storing customer data in software (CRM, CDP, etc.) problematic?

Customer data stored in applications is problematic for several reasons rarely mentioned by publishers, integrators, and other ESNs (Enterprise Social Networks) who take advantage of the prison implied by this coupling.

guantanomo numérique

The “Digital Guantanamo”, evoked by Louis Naugès, where ESN play the role of guardians of the imprisoned CIOs.

Customer data is your most valuable asset. However, CRM, CDP, and Marketing Automation publishers only give you restricted access to this data. You’re a prisoner of the data models imposed by the software; you can’t access your data in their raw state and organize them in the data model of your choice. You are limited by the infrastructure choices of the solution vendor.

The business consequences are more serious than they appear. Lacking flexibility of data models reduces the ability of your marketing teams to adapt the scores and processing rules to your business specifics. Less targeted campaigns or less personalization can be fatal in the race for the ultimate omnichannel customer relationship led by brands today.

The other direct consequence of this low flexibility is that your teams lack progress and maturity in exploiting customer data. Your business teams will not learn to imagine use cases outside the framework offered by your CRM or CDP, and you will miss opportunities within your customer journey.

Discover business use cases

To help you imagine what you can do with full control over your data, we have put together a library of concrete use cases, don’t hesitate to consult it.

On the other hand, access to your customer database, organized and stored in your CRM/CDP, is chargeable. You must pay access fees to view and use your data! As everyone knows, the economic model of classic solutions for activating customer data (CRM, Marketing Automation, ERP, CDP) is based on pricing by several users. Even a user who only needs access to the database on a very occasional basis will have to pay a subscription.

In fact, you are locked into a specific ecosystem, built by the publisher, that cuts you off from outside. It can be vast: think of CRMs that offer dozens of different modules. But it is still a rigid framework.

The BlackBerry example

To illustrate, let’s take the example of BlackBerry. We owe this example to David Bessis, who describes it in a beautiful Medium article dedicated to the rise of open data technologies. Broadly, BlackBerry was the king of the world from 2001 to 2008. And then came the iPhone, in 2007. And then a bit later, Android. And boom, BlackBerry collapsed.

Between 2008 and 2012, BlackBerry’s market share was divided by 20. There are several reasons for this, but the main one is this: BlackBerry was built like a black box. Nobody could create BlackBerry applications; BlackBerry had a stronghold on writing the code…unlike iOS and Android, which immediately positioned themselves as open platforms.

Like BlackBerry, CRM / CDP publishers are closed platforms that hinder the development and enrichment of your data use cases. Think about it, how freer you would be if you could have your data in a database, independent of your CRM/CDP, to use it in other tools for other purposes!

A solution, even if it’s a suite of software, cannot do everything. Locking yourself into a publisher’s ecosystem inevitably means missing out on specific uses of customer data.

How does modern stack data allow you to regain control of your data?

We showed a problem: the coupling of data with applications. The consequence is lacking control of your customer data. Let’s now talk about the solution: Modern Stack Data. 

The term is barbaric, jargon, we grant you, but it designates a simple reality. It is a new way of organizing data, a tripartite organization:

  1. A Cloud Datawarehouse which serves as the company’s database. It is the main enterprise database that helps unify structured and semi-structured data.
  2. Business tools that exploit data for analysis and manly activation purposes. BI tools such as Tableau or PowerBI and, above all, tools such as CRM, Marketing Automation, Google/Facebook Ads, Diabolocom, etc.
  3. An ETL and/or a Reverse ETL allows data to circulate between the Datawarehouse and the other company systems: the software.

The modern Data warehouse as an operational base

Note that we are not talking here about the new generation Data warehouses, which have been booming since the beginning of the 2010s: cloud Data warehouses. We think of names like BigQuery (Google), Snowflake, Redshift (Amazon), or Azure (Microsoft) that have become democratized and are now accessible to SMEs and startups.

So, what are we talking about? 

A modern Data warehouse is a cloud database used to store all of the company’s structured or semi-structured data. More than just a warehouse, a Data warehouse is a war machine that allows you to execute SQL queries and perform operations on huge volumes of data…all much faster than transactional databases ( OLTP).

We are convinced today:

  • That the data must be stored in a separate database from the software.
  • That the Cloud Data warehouse is by far the most powerful and economical solution to act as a master database.

With this in mind, the Data warehouse is intended to become the keystone, the pivotal solution of the modern company’s information system. 

In this article on the Modern Stack Data, we go more into detail about our convictions regarding Data warehouse-type cloud infrastructures and the main advantages of these solutions. Also, discover our article “Why you should use your Data Warehouse to play the role of Customer Data Platform.”

ETL & Reverse ETL

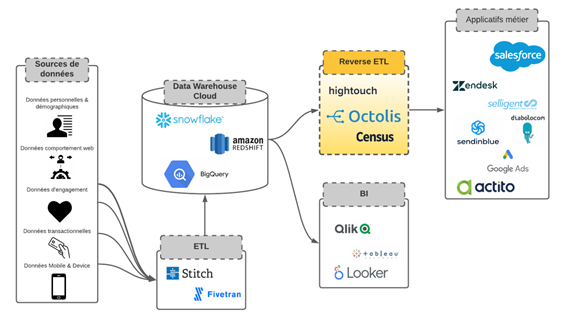
We can represent Modern Stack Data in this way:

octolis

ETL and Reverse ETL are the tools that allow data to circulate better in the information system and tools while maintaining control. More specifically:

  • ETL (Extract – Transform – Load) is the technology that connects to data sources, transforms them, and loads them into the Datawarehouse cloud. Two examples of ETL? Stitch Data & Fivetran.
  • The Reverse ETL is a more recent family of solutions that allows data to be redistributed from the Data Warehouse to business tools (CRM, Marketing Automation, e-commerce, etc.), in the form of segments, aggregates, and scorings. It is the centerpiece that allows business teams to access data from the data warehouse. An example of Reverse ETL? Octolis!

customer data stack

It is this modern data architecture, linking Data Warehouse Cloud and ETL/Reverse ETL, which ensures the highest level of data control:

  • Data are kept in a software-independent database. They are stored neither in your business applications, ETL, nor your Reverse ETL, but your data warehouse.
  • You can create custom data models to meet your specific needs and use cases.
  • The calculation performance of your database is much better than that offered by CRM/CDP editors.
  • You centrally and granularly control access and permissions to the database (the DWH).

Conclusion

Companies need to be aware of the risks and costs of storing customer data in software, no matter how powerful CDPs are. Today, it is possible and desirable to regain control over your customer data. 

We have seen that this requires a new organization of your data called the “modern data stack”: your customer data is hosted and consolidated in a Data Warehouse and redistributed to your software via a “Reverse ETL” like Octolis.

Data sovereignty is a necessary (although not sufficient) condition for deploying innovative, and ROIst data use cases. Taking back control of your customer data is the first step to becoming truly data-driven.